Training Overview
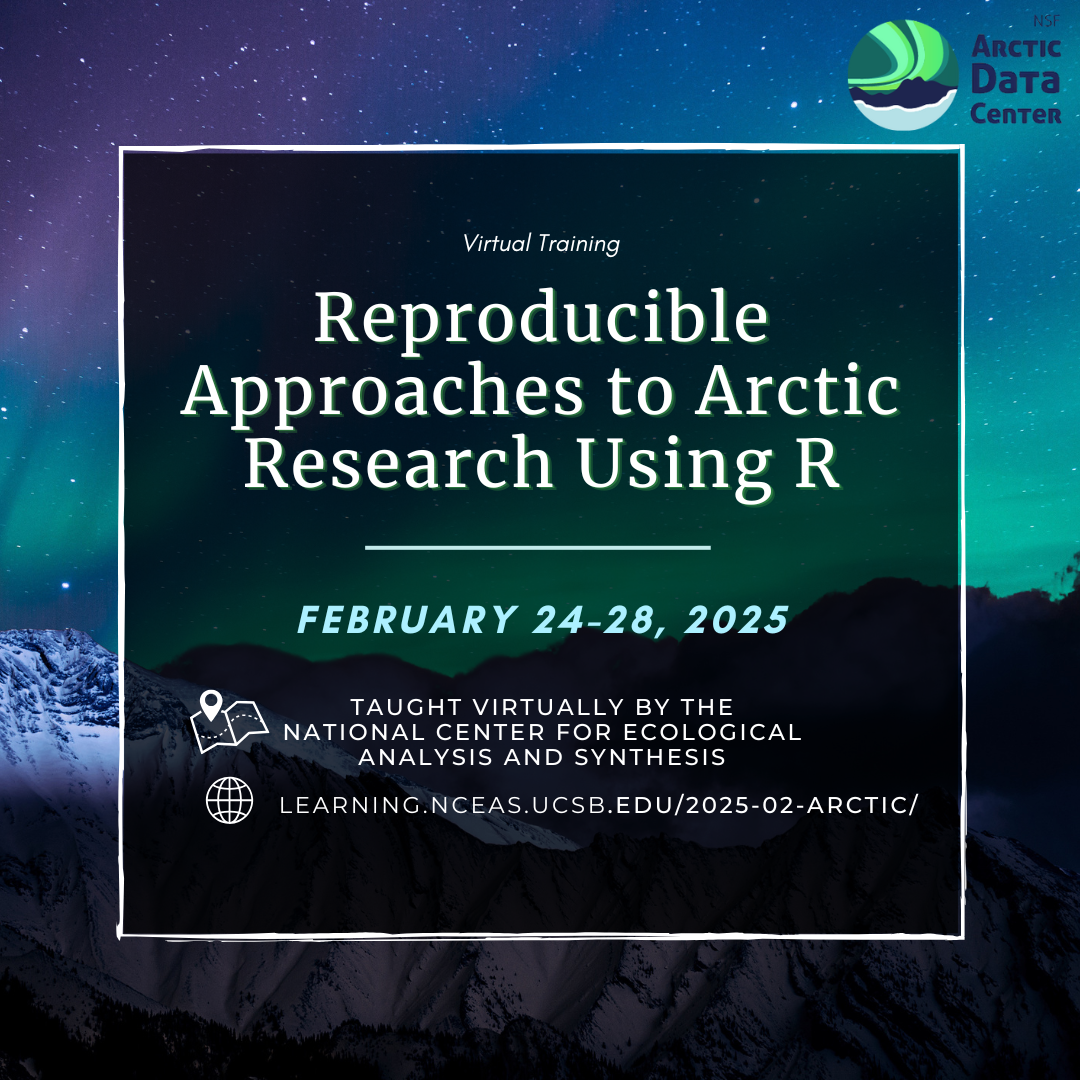
The Arctic Data Center (ADC) held the annual virtual Reproducible Approaches to Arctic Research Using R training from February 24-28th, 2025 for 14 Arctic researchers from across the globe. Participants ranged from undergraduate students to senior-level scientists with a diverse range of research disciplines. This 4.5-day long course gave participants an overview of reproducible and ethical research practices, best practices for more easily documenting and preserving their data at the Arctic Data Center, and using RStudio and GitHub for seamless collaboration and programming.
Tools and Techniques Covered
When possible, workshop content is organized so that more technical lessons fall during morning to early-afternoon time slots, and we end the day with non-technical or hands-on practice lessons.
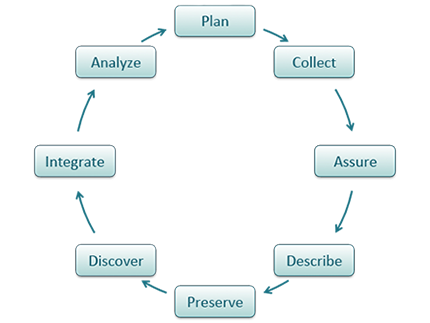
 Day 1 began with virtual platform logistics and a broad introduction to the ADC that provided an overview of the tools and support available to researchers. We then set up Git and RStudio, which gave all participants access to our remote server and minimized time spent troubleshooting common local system issues.As participants of this course are expected to have intermediate programming skills, we do not cover the fundamentals of coding. Instead, we work through creating and organizing an R project and moving around the project using paths and working directories. Afternoon sessions covered an introduction to using Quarto for literate programming, recommendations for creating successful data management plans, and a guide to submitting data to the ADC.
Day 2 kicked off with an introduction to git and GitHub and covered topics such as version control and creating a remote repository. This was followed by an introduction to data modeling essentials including best practices for tidy data, data normalization, table joins, and a small group exercise on entity-relationship diagrams. Day 2 wrapped up with a tutorial on cleaning and wrangling data, which introduced the dplyr and tidyr functions and Split-Apply-Combine strategy that are helpful in preparing data for analysis.
The third day consisted primarily of technical and hands-on lessons, beginning with an exercise in collaborating using git and GitHub where participants paired up to commit, push, and pull changes to a shared repository. The mid-day session focused on publishing analyses and scientific reports to the web using Quarto documents and an introduction to data visualization using the ggplot2 package.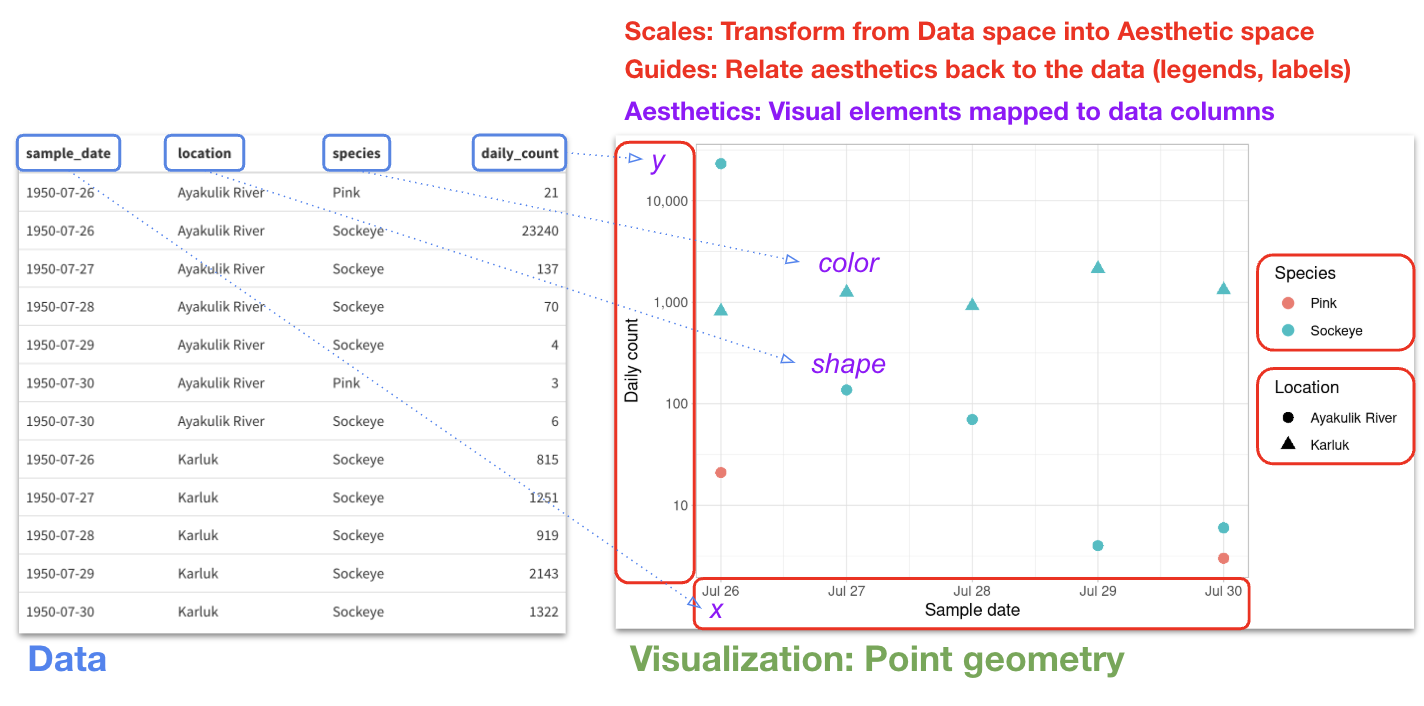 Participants were given an overview of ggplot2’s theme and other customization options to create advanced, publication-quality graphics. Day 3 concluded with the first of two R practice sessions where participants had the opportunity to work with environmental data and collaborate with a partner on creating and publishing a scientific report using GitHub pages. This lesson was adapted from Allison Horst’s Scientific Programming Essentials curriculum from the Bren School’s Master of Environmental Data Science program.
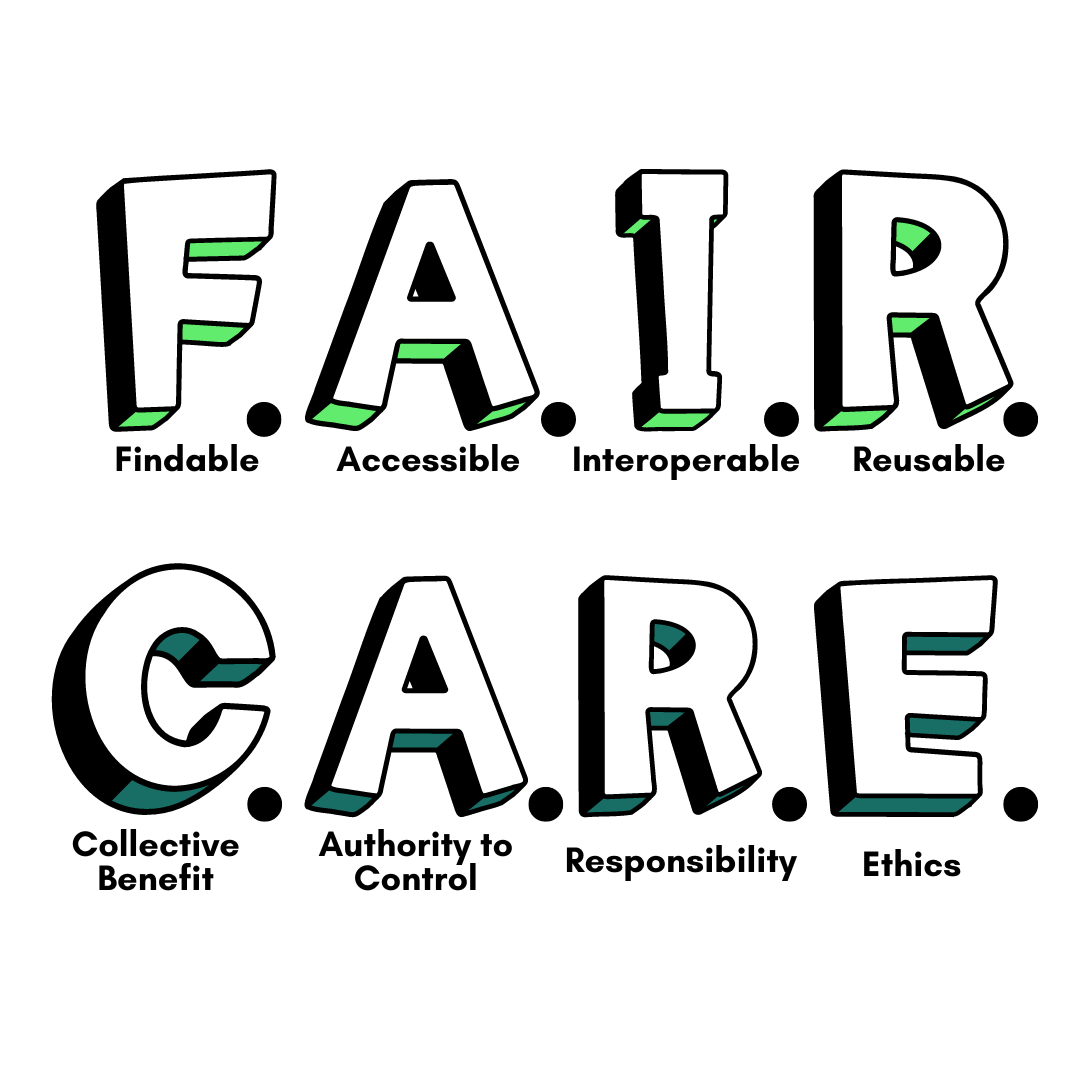 Thursday, the last full day of the course, was packed with a mixture of technical, non-technical, and hands-on activities on a wide range of topics. The morning began with a detailed lesson on writing functions and building packages in R with an emphasis on improving code communication and documentation. The day was broken up by an activity and discussion aimed at helping participants identify and appreciate the different thinking preferences within a group and understand how these differences can influence collaboration and group work, followed by an overview of the FAIR (findable, accessible, interoperable, reusable) and CARE (collective benefit, authority to control, responsibility, ethics) principles and guidelines for collecting data ethically. The day concluded with the second R practice session, which focused on writing and documenting R functions for the Arctic Data Center dataset, Richard Lanctot and Sarah Saalfeld. 2019. Utqiaġvik shorebird breeding ecology study, Utqiaġvik, Alaska, 2003-2018. Arctic Data Center. doi:10.18739/A23R0PT35.
The final day of the course consisted of two lessons: the first on working with spatial data and the second on reproducibility and provenance. The spatial data lesson taught participants how to use the sf package to wrangle spatial data, static mapping with ggplot, adding basemaps to static plots, and how to create interactive maps with leaflet. The lesson used a shapefile of Alaska regions, rivers, and population data to create a detailed, color-coded map of the state. The final lesson covered the concept of reproducible workflows, including computational reproducibility and provenance metadata, and how to use R to build a reproducible paper in RMarkdown/Quarto. The course concluded with an anonymous survey to collect feedback on course curriculum and logistics, as well as an open discussion where participants can share verbal feedback that we incorporate into future course offerings.
Virtual Participation & Engagement
Due to time constraints and issues that often arise when installing software to program locally, ADC courses utilize a remote server that is easily accessible by participants and instructors. The virtual course is held via Zoom, with side discussions held and questions answered through the Slack messaging platform. When participants need additional support during a lesson, instructors who are not actively teaching open Zoom breakout rooms for brief troubleshooting sessions. Non-verbal feedback buttons are activated throughout the course, allowing participants to signal whether their code is running without errors (✅) or if they need additional time and/or assistance (❌) before moving on with the lesson.
Curious about the ADC’s approach to virtual hands-on trainings? Check out this blog post from November 2020, written by previous ADC Data Science Fellow Sarah Erickson.
Meet The Participants
 Pascal Egli, an Associate Professor in Physical Geography at the Norwegian University of Science and Technology attended the course from Trondheim, Norway. When asked about his favorite part of the course, Pascal said “working with GitHub and using Markdown/Quarto, but also discovering some nice visualization capabilities of R!”. For others interested in taking the course, Pascal explained that “it is a diverse and well-structured course, where you learn about the fundamentals in conducting reproducible research using R, but also get some general notions of proper data handling and representation. It is a varied course that offers both theory and practice”. Pascal noted that attending from 6pm to 2am (local time) after short work days was a special challenge that he ended up enjoying.
 Additionally, Joana Steffens, a PhD student in oceanography from the Institut des sciences de la mer (ISMER) at the Université du Québec à Rimouski attended the course and really liked the diversity that the course covered. She explained that “we learned about data archiving and how to store and organize your data, we also learned about the FAIR and CARE principles and how to work in a group with people of different thinking styles. Since I am a self-taught RStudio user, the main benefit for me in this course was learning how to write functions, how to visualize your data and work with spatial data in R, and how to organize a co-working space on GitHub. I also enjoyed the atmosphere of the course, the organizing team created a safe space where you could ask questions and get help at any time”. For others interested in taking the course, Joana explained “I would recommend this course to others, especially if you are a self-taught RStudio user like me and want to get a little more than just the basics. Also, I would recommend this course to anyone interested in data organization and archiving. For those who are interested, do not be afraid to ask questions and try to use this course as an opportunity to network with people who are facing the same issues”.
Openly Accessible Course Materials
The Arctic Data Center’s Reproducible Data course has continuously evolved throughout many years of teaching and has inspired many of the trainings taught by the National Center for Ecological Analysis and Synthesis Learning Hub. The coursebook for the 2025 Reproducible Approaches to Arctic Research Using R is openly available here. Additionally, you can find coursebooks from our previous trainings on our website here, updated after each training concludes.
Written by Nicole Greco
Community Engagement & Outreach Coordinator
