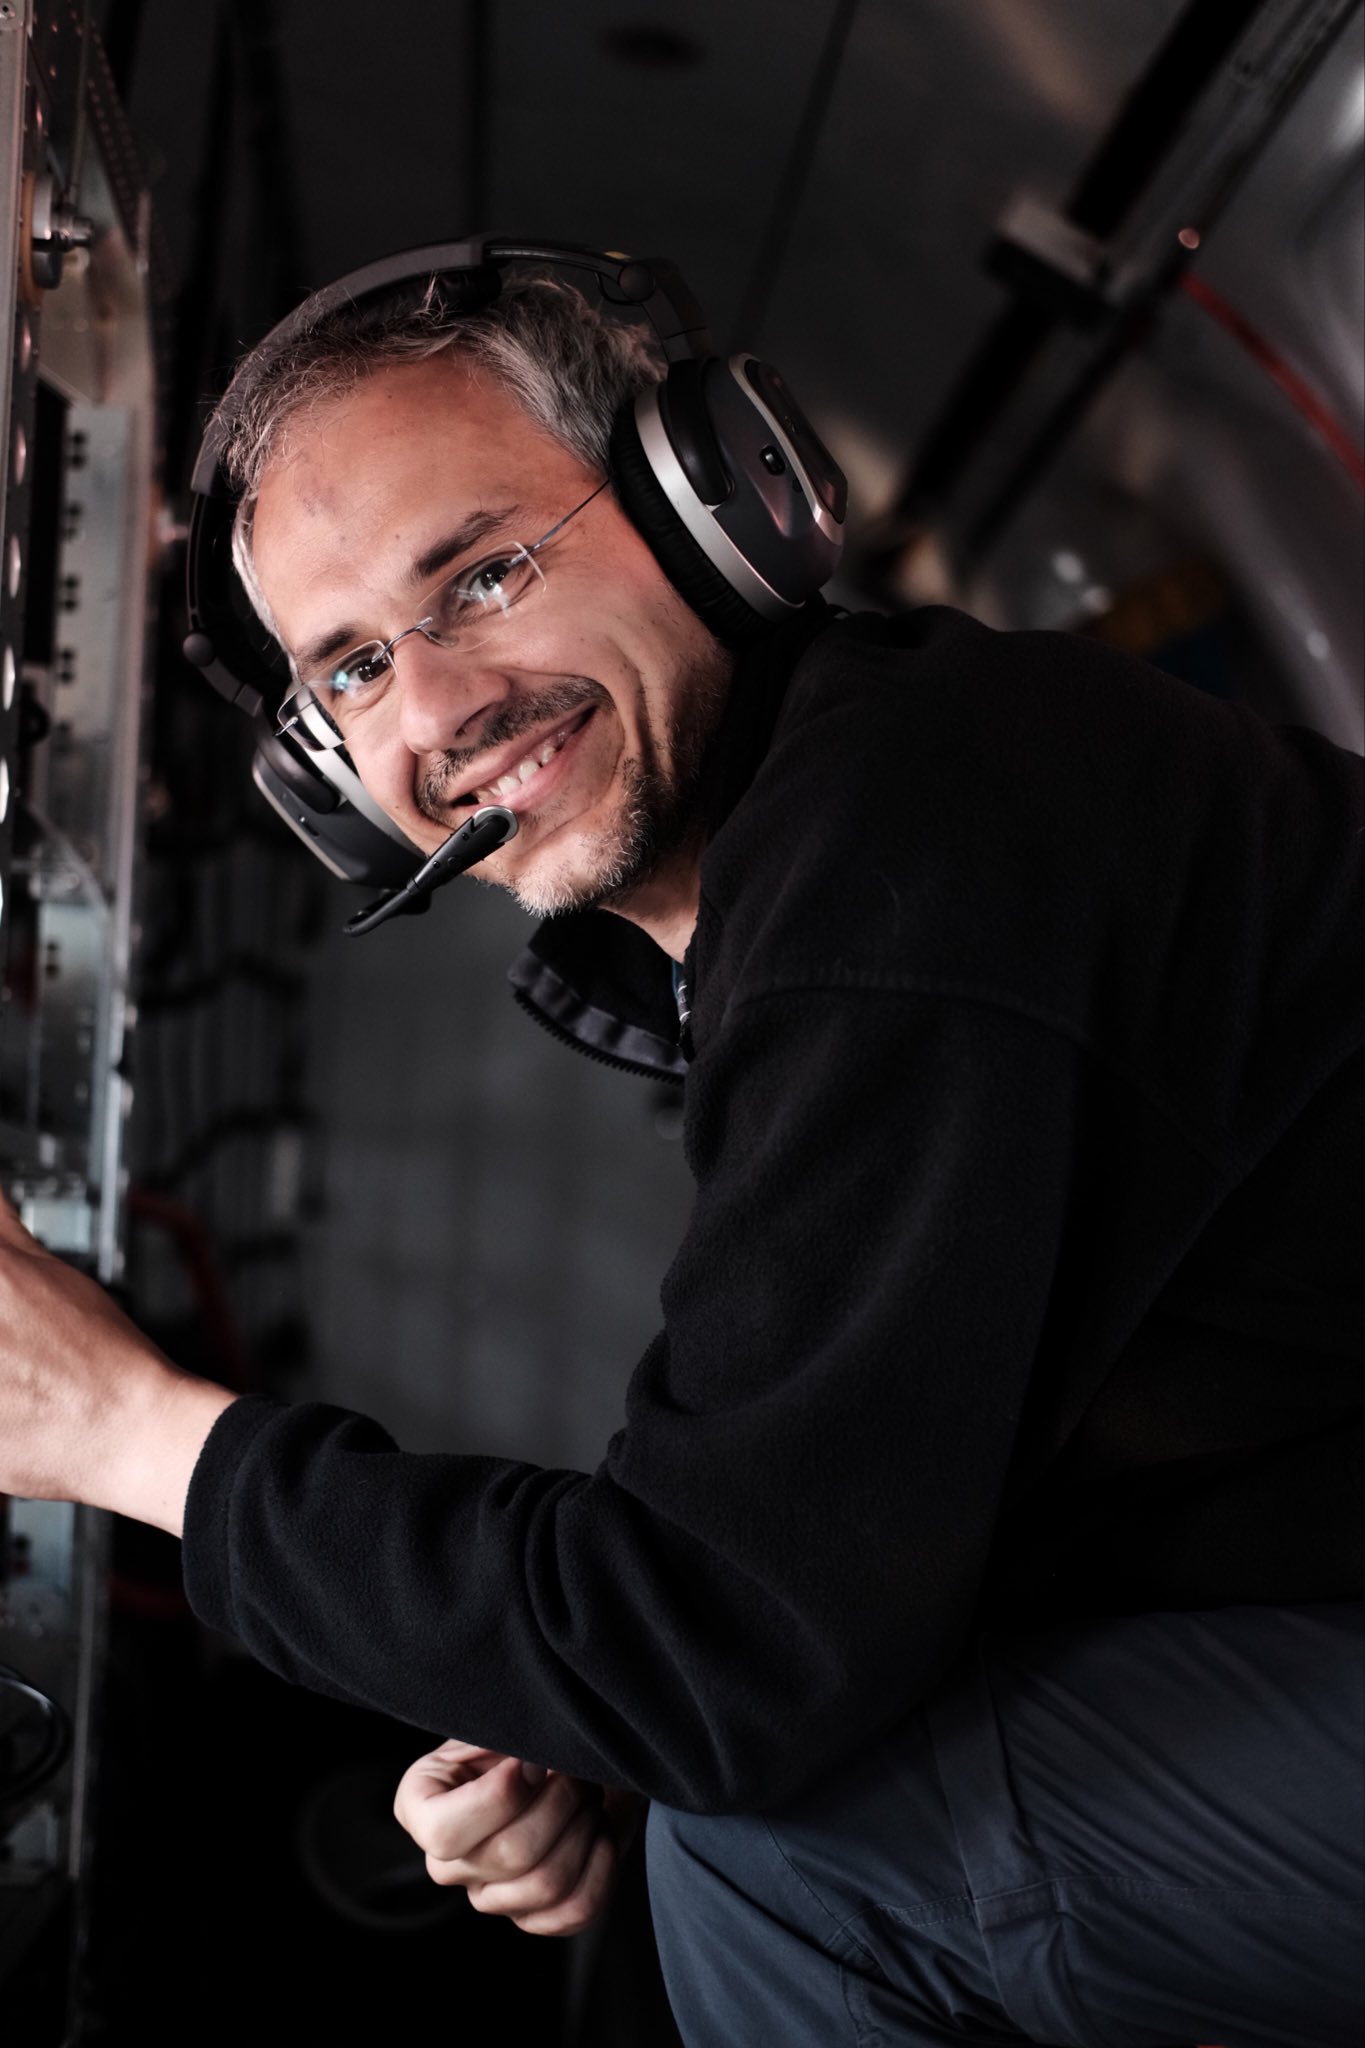
Ingmar Nitze during an aerial survey campaign.
Photo credit: Carl Stadie, 2024.
Background and Research Expertise
Dr. Ingmar Nitze has always considered himself a “geo-geek” with a passion for all things geospatial, and naturally gravitated toward the field of physical geography for his studies. During his academic journey, he developed a strong interest in geoinformatics and remote sensing, tools that would later become central to Nitze’s research. As a student, Nitze worked for a satellite company called RapidEye from 2009-2011, which shaped his focus on processing large quantities of Earth observation data. His first research position, based in Cork, Ireland, focused on temperate agricultural systems, offering valuable experience in applying geospatial techniques to real-world environmental challenges. In 2014, a new opportunity led him north to the world of Arctic research. Since then, Nitze has been immersed in studying permafrost and the changing dynamics of Arctic landscapes as a PhD Student and later postdoctoral researcher at the Alfred Wegener Institute.
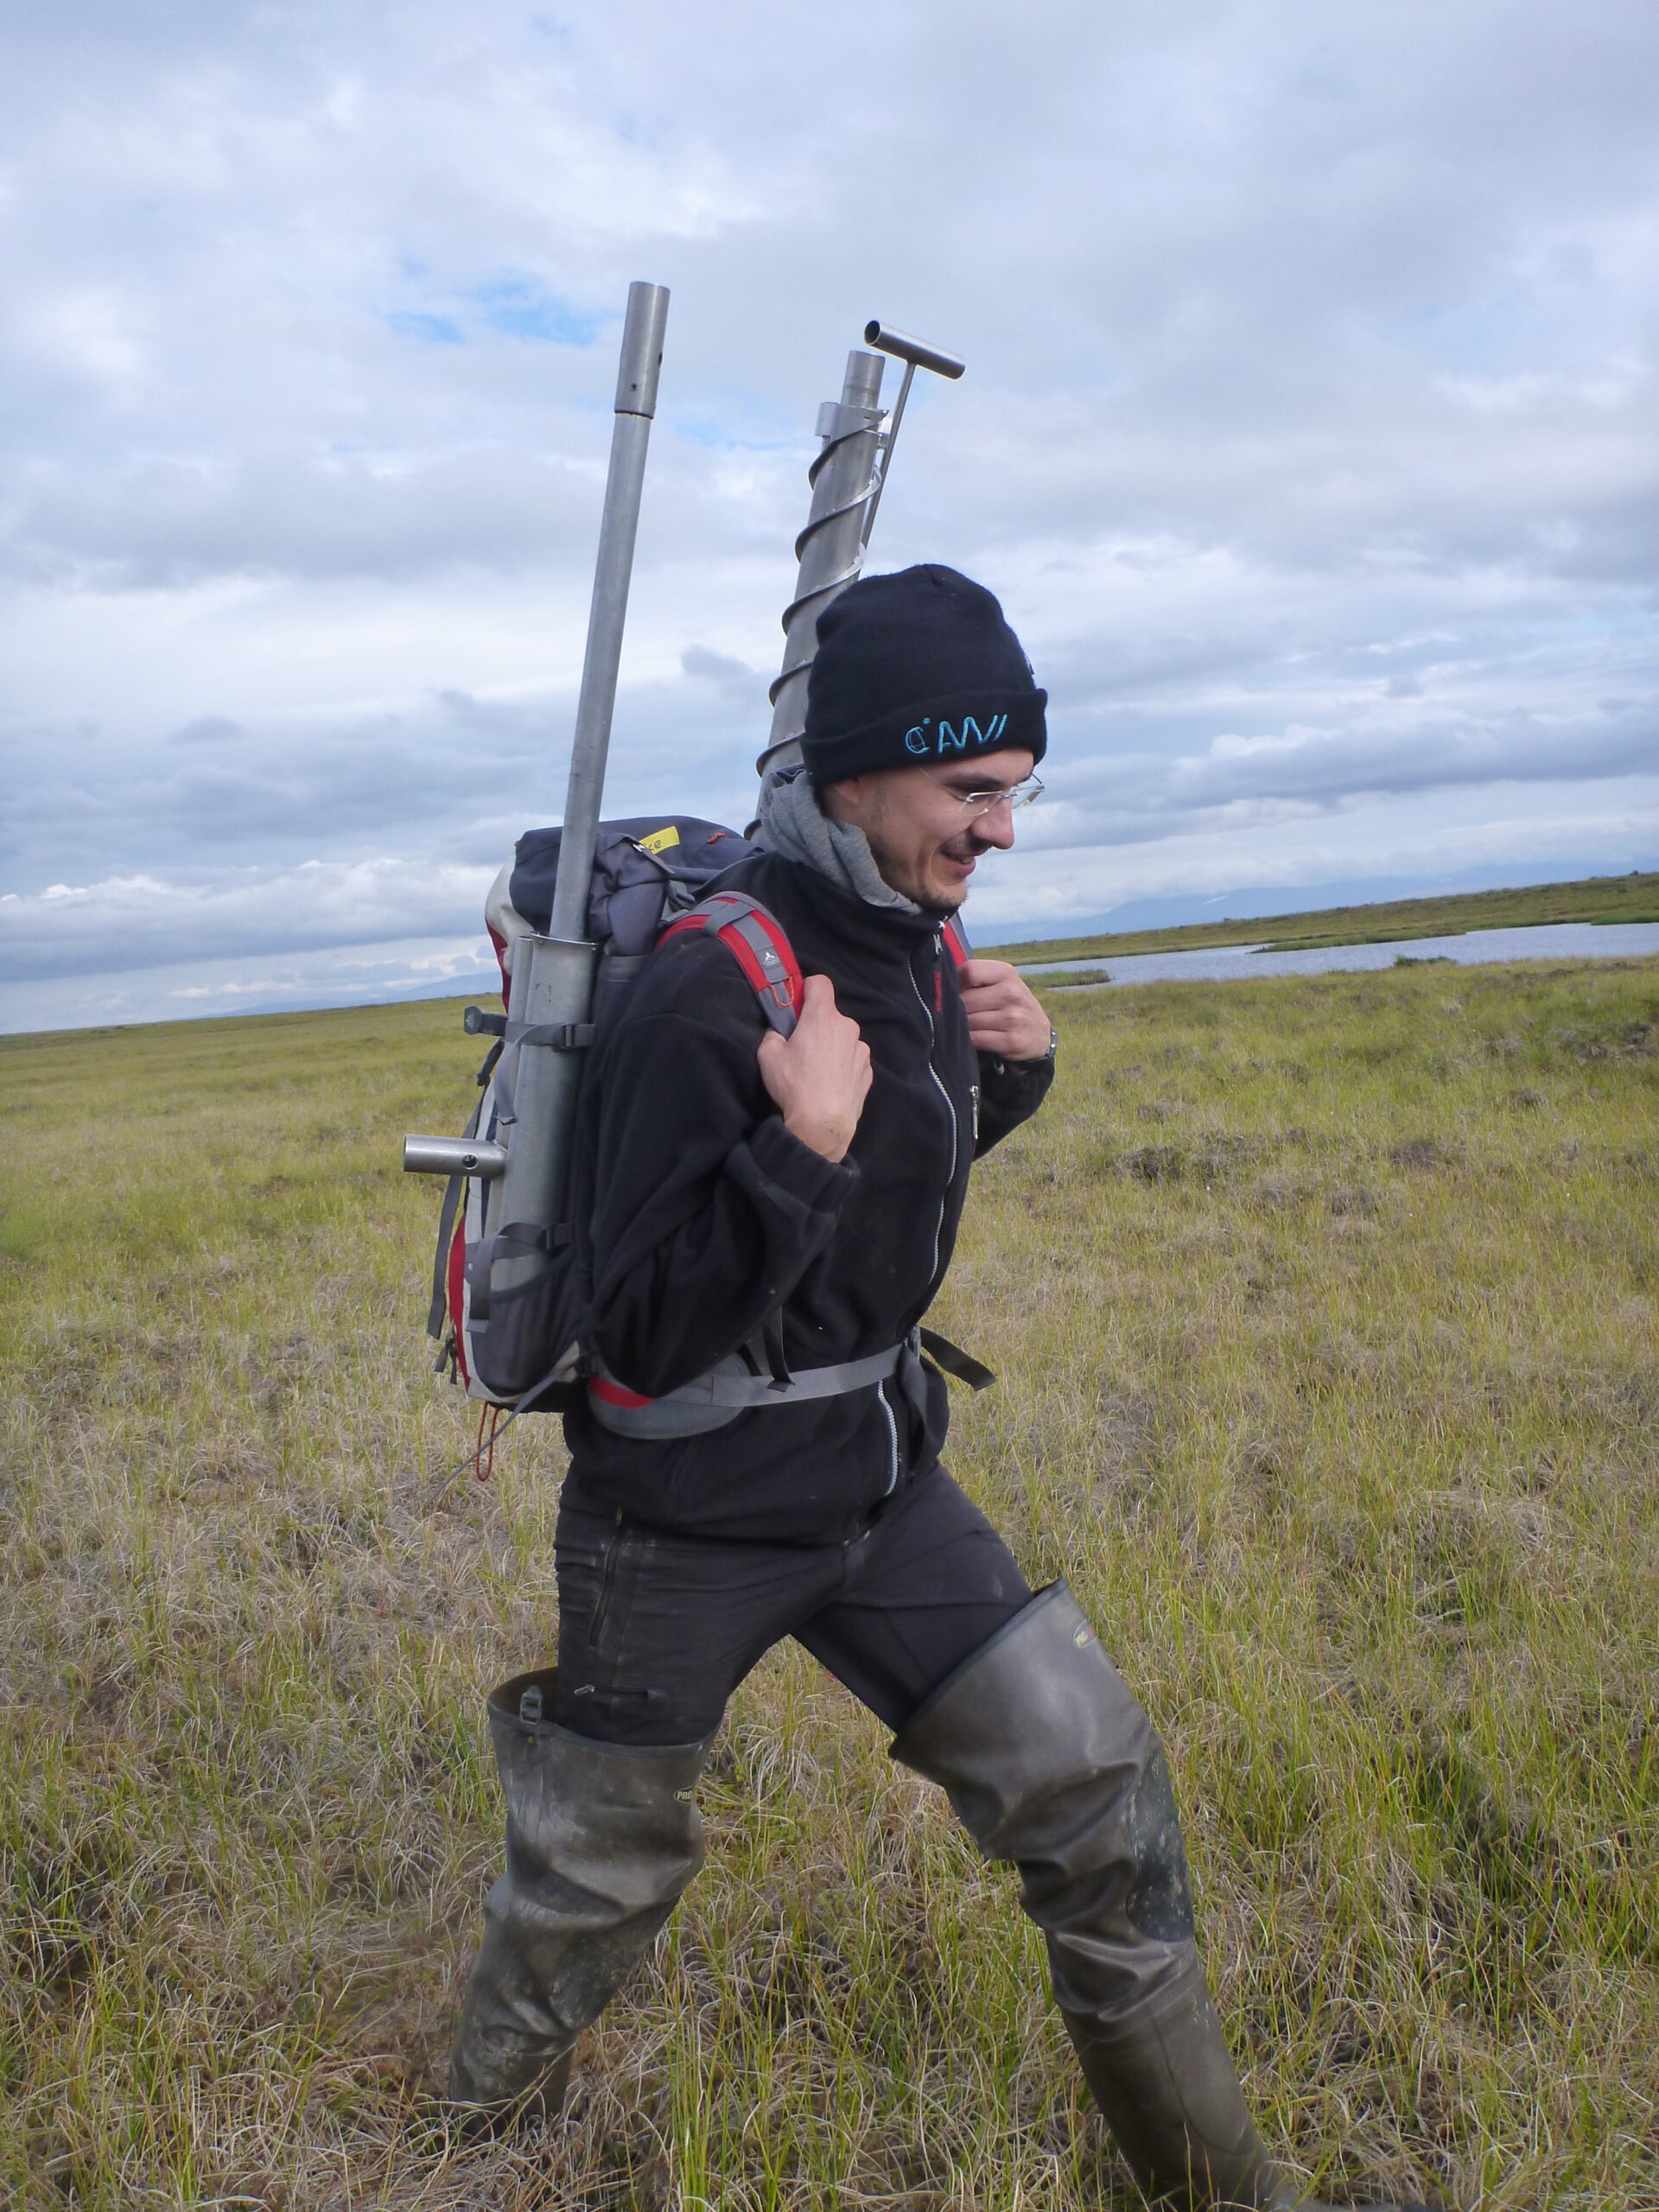
Ingmar Nitze carrying drilling gear through the tundra in West Alaska. Photo credit: Guido Grosse, 2016.
Nitze’s research focuses on permafrost, or ground that stays frozen for at least two consecutive years. He explains that permafrost can be composed of frozen soil, rock, and even organic material that stores large amounts of carbon. The concern is that as the Arctic warms, this frozen ground starts to thaw, potentially releasing greenhouse gases like carbon dioxide and methane into the atmosphere, which can further accelerate climate change.
Nitze further explains that although permafrost covers vast areas of the Northern hemisphere, it’s still poorly represented in current climate models largely due to data sparsity, especially on the different ways permafrost is thawing. He explains that while some gradual thaw processes (e.g. thickening of the seasonal thaw layer) are beginning to be incorporated into models, rapid changes like sudden ground collapse (thaw slumps) or shifts in Arctic lakes aren’t yet well understood or quantified. Nitze’s goal is to fill this knowledge gap: to better understand how permafrost is reacting to climate change, how it’s thawing, and what that means for future climate feedbacks. He hopes that improving how these processes are represented in climate models will put us in a much better position to predict and plan for what’s coming.
Dataset Highlight
The DARTS dataset maps areas of thawing ground, or retrogressive thaw slumps, across Arctic and Subarctic regions. These features were identified using satellite imagery and an automated deep learning method. The imagery, taken between 2021 and 2023, covers ~1.6 million square kilometers, with more frequent data available with higher temporal coverage (2018-2023) for especially active sites like Banks Island and Peel Plateau in Canada, and Novaya Zemlya in Siberia. More than 43,000 thaw slumps and related erosion features were mapped, many more than once.

Oblique aerial photo of the Selawik Slump in West Alaska. Photo credit: Ingmar Nitze, 2014
Nitze’s work combines high-resolution satellite imagery, at an impressive 3-meter spatial resolution, with a variety of other geospatial data sources such as digital elevation models and coarser-resolution grid maps. These different layers of data are pre-processed using remote sensing techniques and then fed into an AI-based image segmentation model.
The model has been trained using examples of known thaw slump locations as well as areas without them. Once trained the model is able to automatically scan and identify potential thaw slumps across vast Arctic regions. However, the input dataset contains terabytes of imagery, making it nearly impossible to analyze manually. The model’s custom code helps automate the processing workflow, enabling this large-scale analysis. Post-processing refines the model’s outputs, correcting many false positives or errors. To support transparency and reuse, the dataset includes comprehensive metadata explaining the source and meaning of the data. The final product was published in the Arctic Data Center where it’s freely available for other researchers, policymakers, and the public to explore:
- Ingmar Nitze, Konrad Heidler, Nina Nesterova, Jonas Küpper, Emma Schütt, Tobias Hölzer, Sophia Barth, Mark J. Lara, Anna Liljedahl, & Guido Grosse. (2025). DARTS: Multi-year database of AI detected retrogressive thaw slumps (RTS) in hotspots of the circum-arctic permafrost region – v1.2. Arctic Data Center. doi:10.18739/A22B8VD7C.

Retrogressive thaw slump at Cape Blossom, Baldwin Peninsula, Alaska. Photo credit: Ingmar Nitze, 2024.
Technological Innovations
When asked about future technological innovations , Nitze notes that recent advances in AI have made powerful tools more accessible to researchers working with large-scale environmental data. Some of today’s models have already been trained on large datasets, giving them a built-in understanding of what the Earth looks like. Nitze explains that scientists can fine-tune models for automation and develop code more efficiently. Looking ahead, he hopes to see improvements in satellite sensor technology. New sensors now offer higher spatial and temporal resolution and could be more available to researchers. For example, synthetic aperture radar (SAR) sensors can capture detailed images regardless of cloud cover or sunlight, making them especially valuable for monitoring remote Arctic regions year-round.
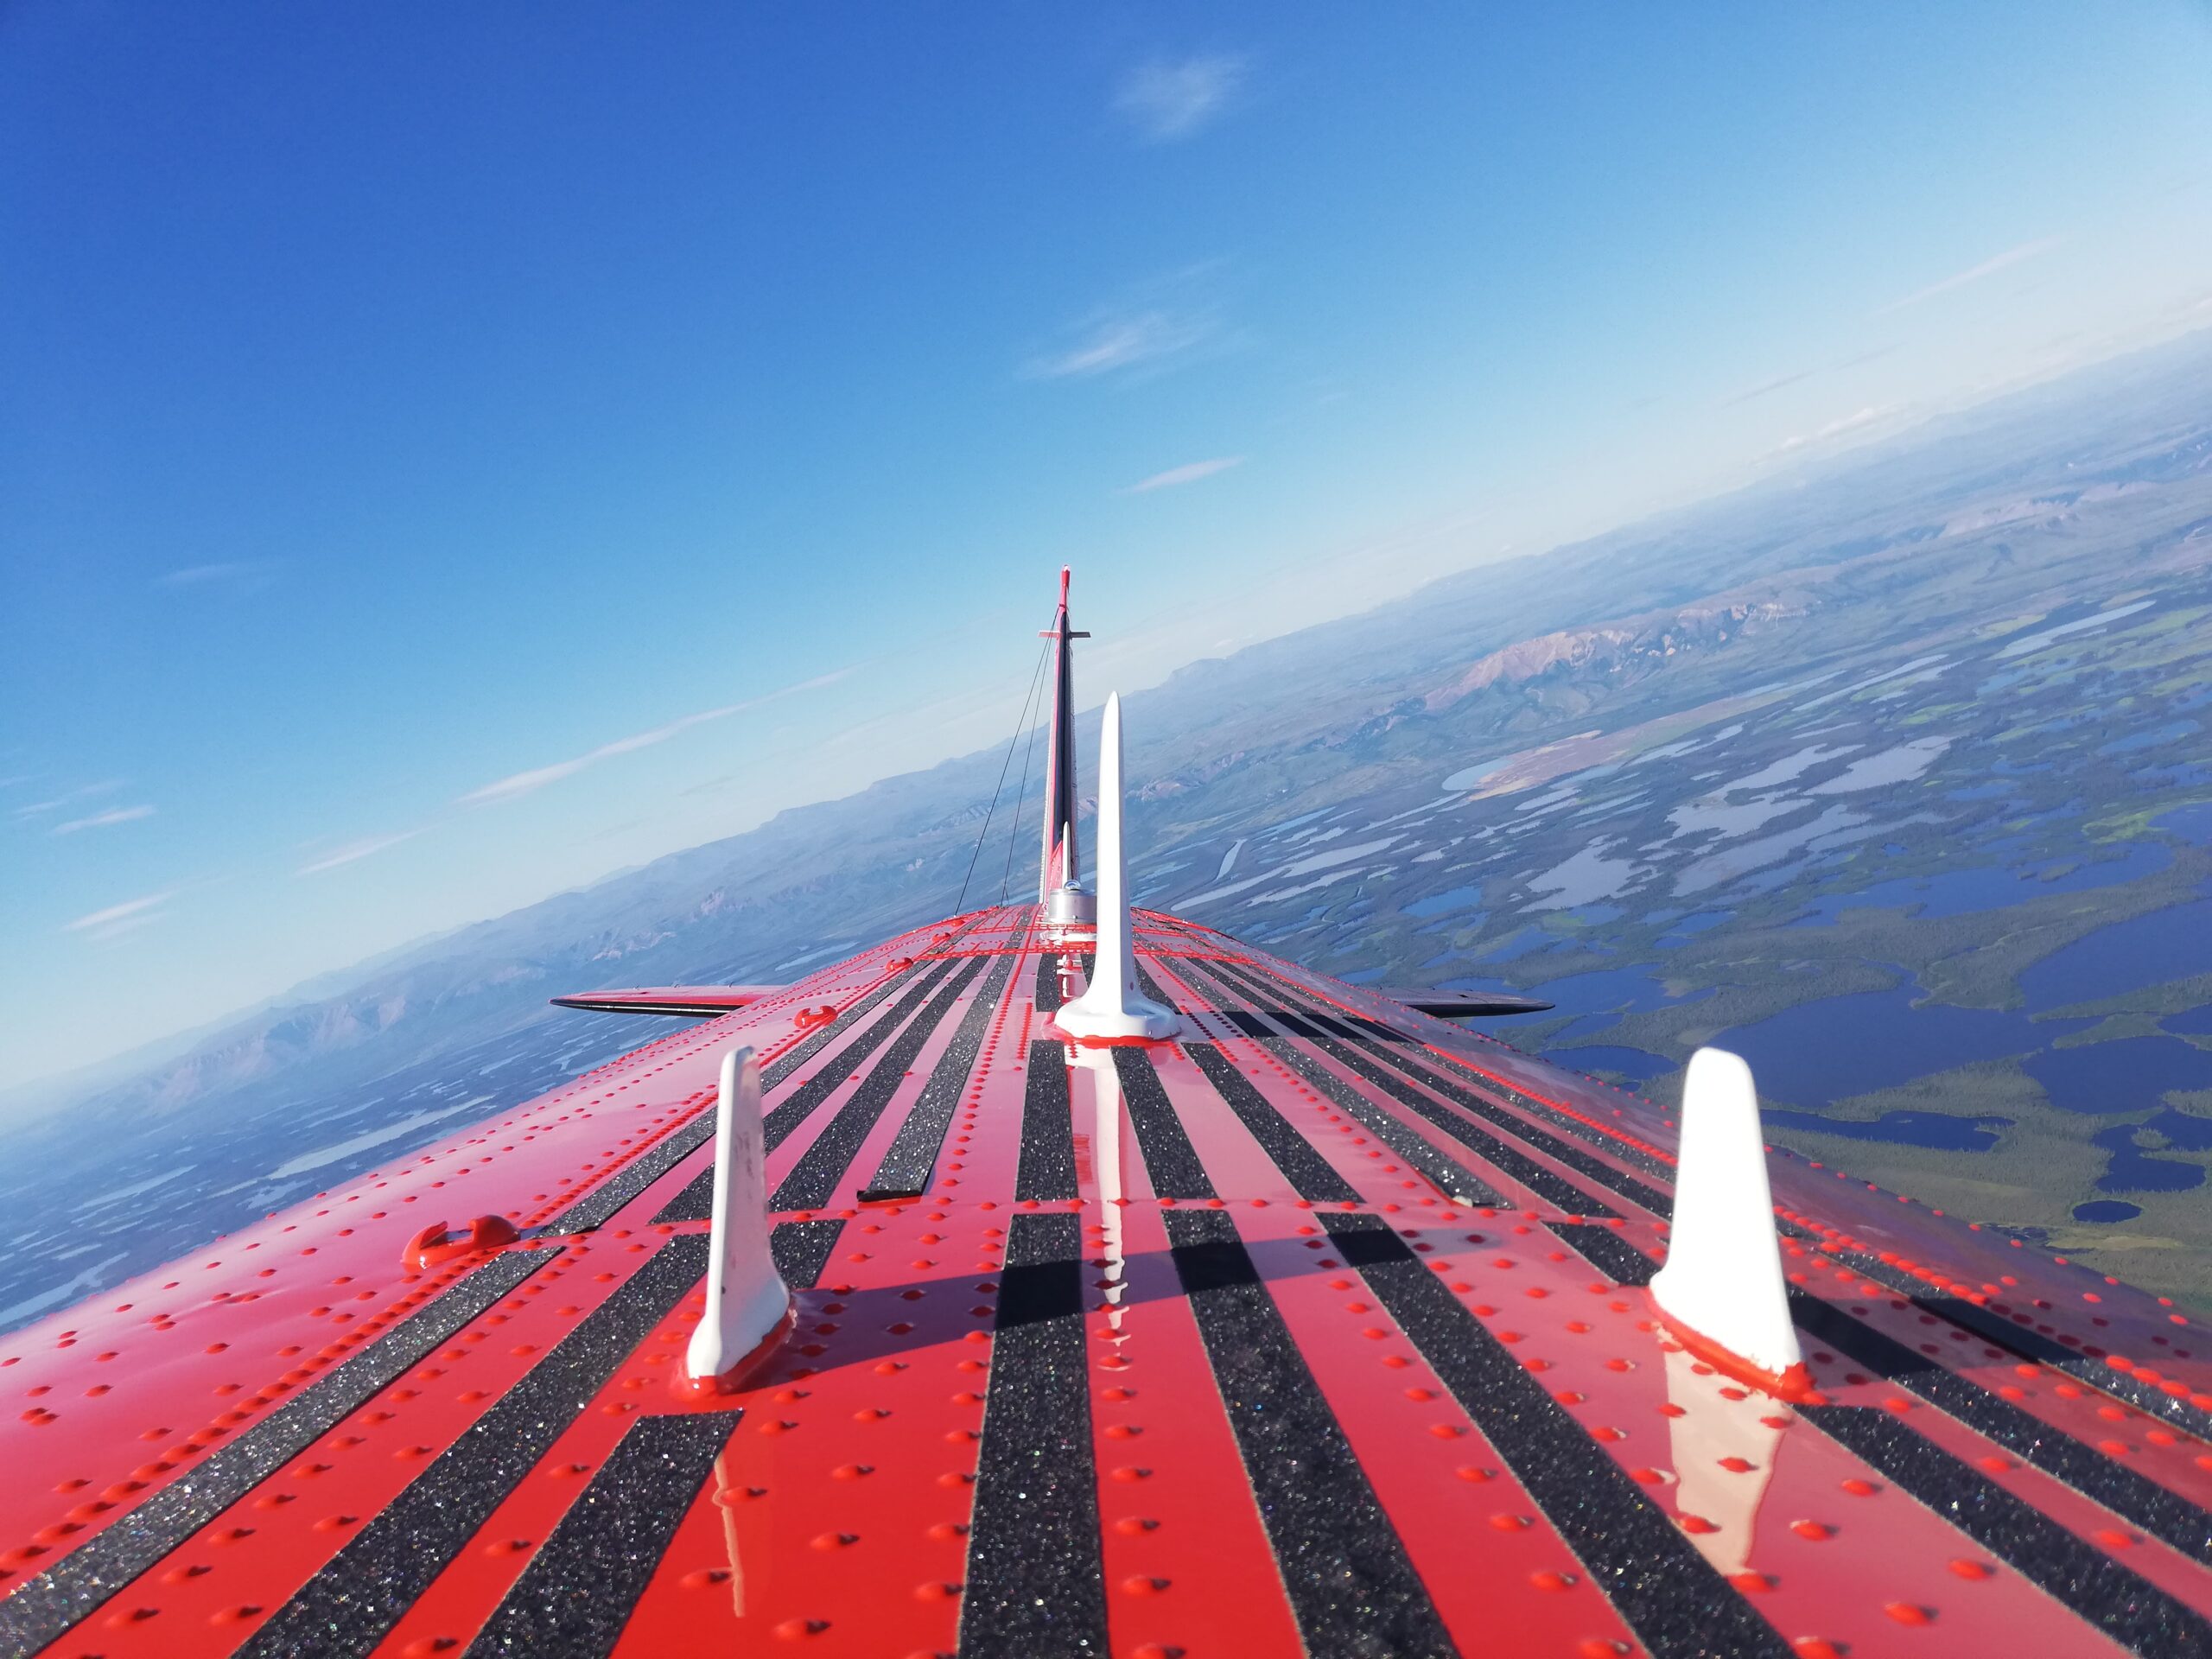
Aft-view over the Polar-6 airplane flying over the Mackenzie Delta, Canada. Photo credit: Ingmar Nitze, 2023.
Working in the Arctic
Much of the Arctic landscape is vast and remote compared to the rest of the world, making it challenging and costly to researchers. As Nitze explains it, this remoteness leads to sparseness of data, which is where tools such as remote sensing help Arctic scientists fill in the gap.
An advantage of the Arctic is its proximity to the North Pole, where many polar orbiting satellites are consistently collecting data at a higher temporal resolution. However, atmospheric conditions are not always ideal because frequent cloud coverage or lack of coverage from snow and other weather conditions make it difficult to collect good data. Summer in the Arctic is the only time researchers can effectively observe permafrost change as the landscape thaws and changes most rapidly.
Use of AI-Based Tools in Arctic Research
In Nitze’s experience, integrating AI-based tools into the DARTS dataset made it possible to scale up the analyses and cover larger regions. Detecting which features were functional and identifying emerging patterns added to the excitement of this work. For example, detections of the muddy slump floor surrounded by the original tundra vegetation helped improve contrast and better detect the active retrogressive thaw slumps. The model even helped detect features and objects in regions the team was not aware of, which really surprised and intrigued Nitze. However, the main challenge was determining when the model’s performance was ready for publication since models are never perfect.
As the DARTS dataset integrates AI-based tools, Nitze emphasizes that its value will continue to grow as models become more accurate and better trained, which will only help in identifying and monitoring permafrost changes. So far, it has improved the detection, monitoring, and prediction of permafrost changes, but Nitze notes the DARTS model’s potential could extend further. As more data becomes available AI models will become better in detecting patterns that the human eye may not be able to manually account for.
Collaborating with the Arctic Data Center
Nitze raves about his experience working with the Arctic Data Center and the Permafrost Discovery Gateway (PDG) teams. He notes how exciting it is to be part of such a large, collaborative effort, and gives credit to Anna Liljedahl, PI of the PDG, for doing an excellent job of bringing teams together and coordinating across groups. He explains that the Arctic Data Center has been “super helpful, and Matt (Jones) and Justin (Kadi) are very responsive and good at taking care of organizing the data and making good metadata”. He goes on to say that having a team that truly cares about making data accessible, usable, and properly managed makes a big difference, especially for large, complex datasets like those often produced in Arctic research.
The DARTS dataset now contains two layers on the PDG portal: one showing the area coverage of retrogressive thaw slumps (in m2) and another showing the outlines of each retrogressive thaw slump, filtered by year from 2018 to 2023. Publication of the DARTS layer would not have been possible without the development work and collaboration between Shirly Stephen, Rushiraj Nenuji, Alyona Kosobokova, and Justin Kadi of the Arctic Data Center and PDG teams.
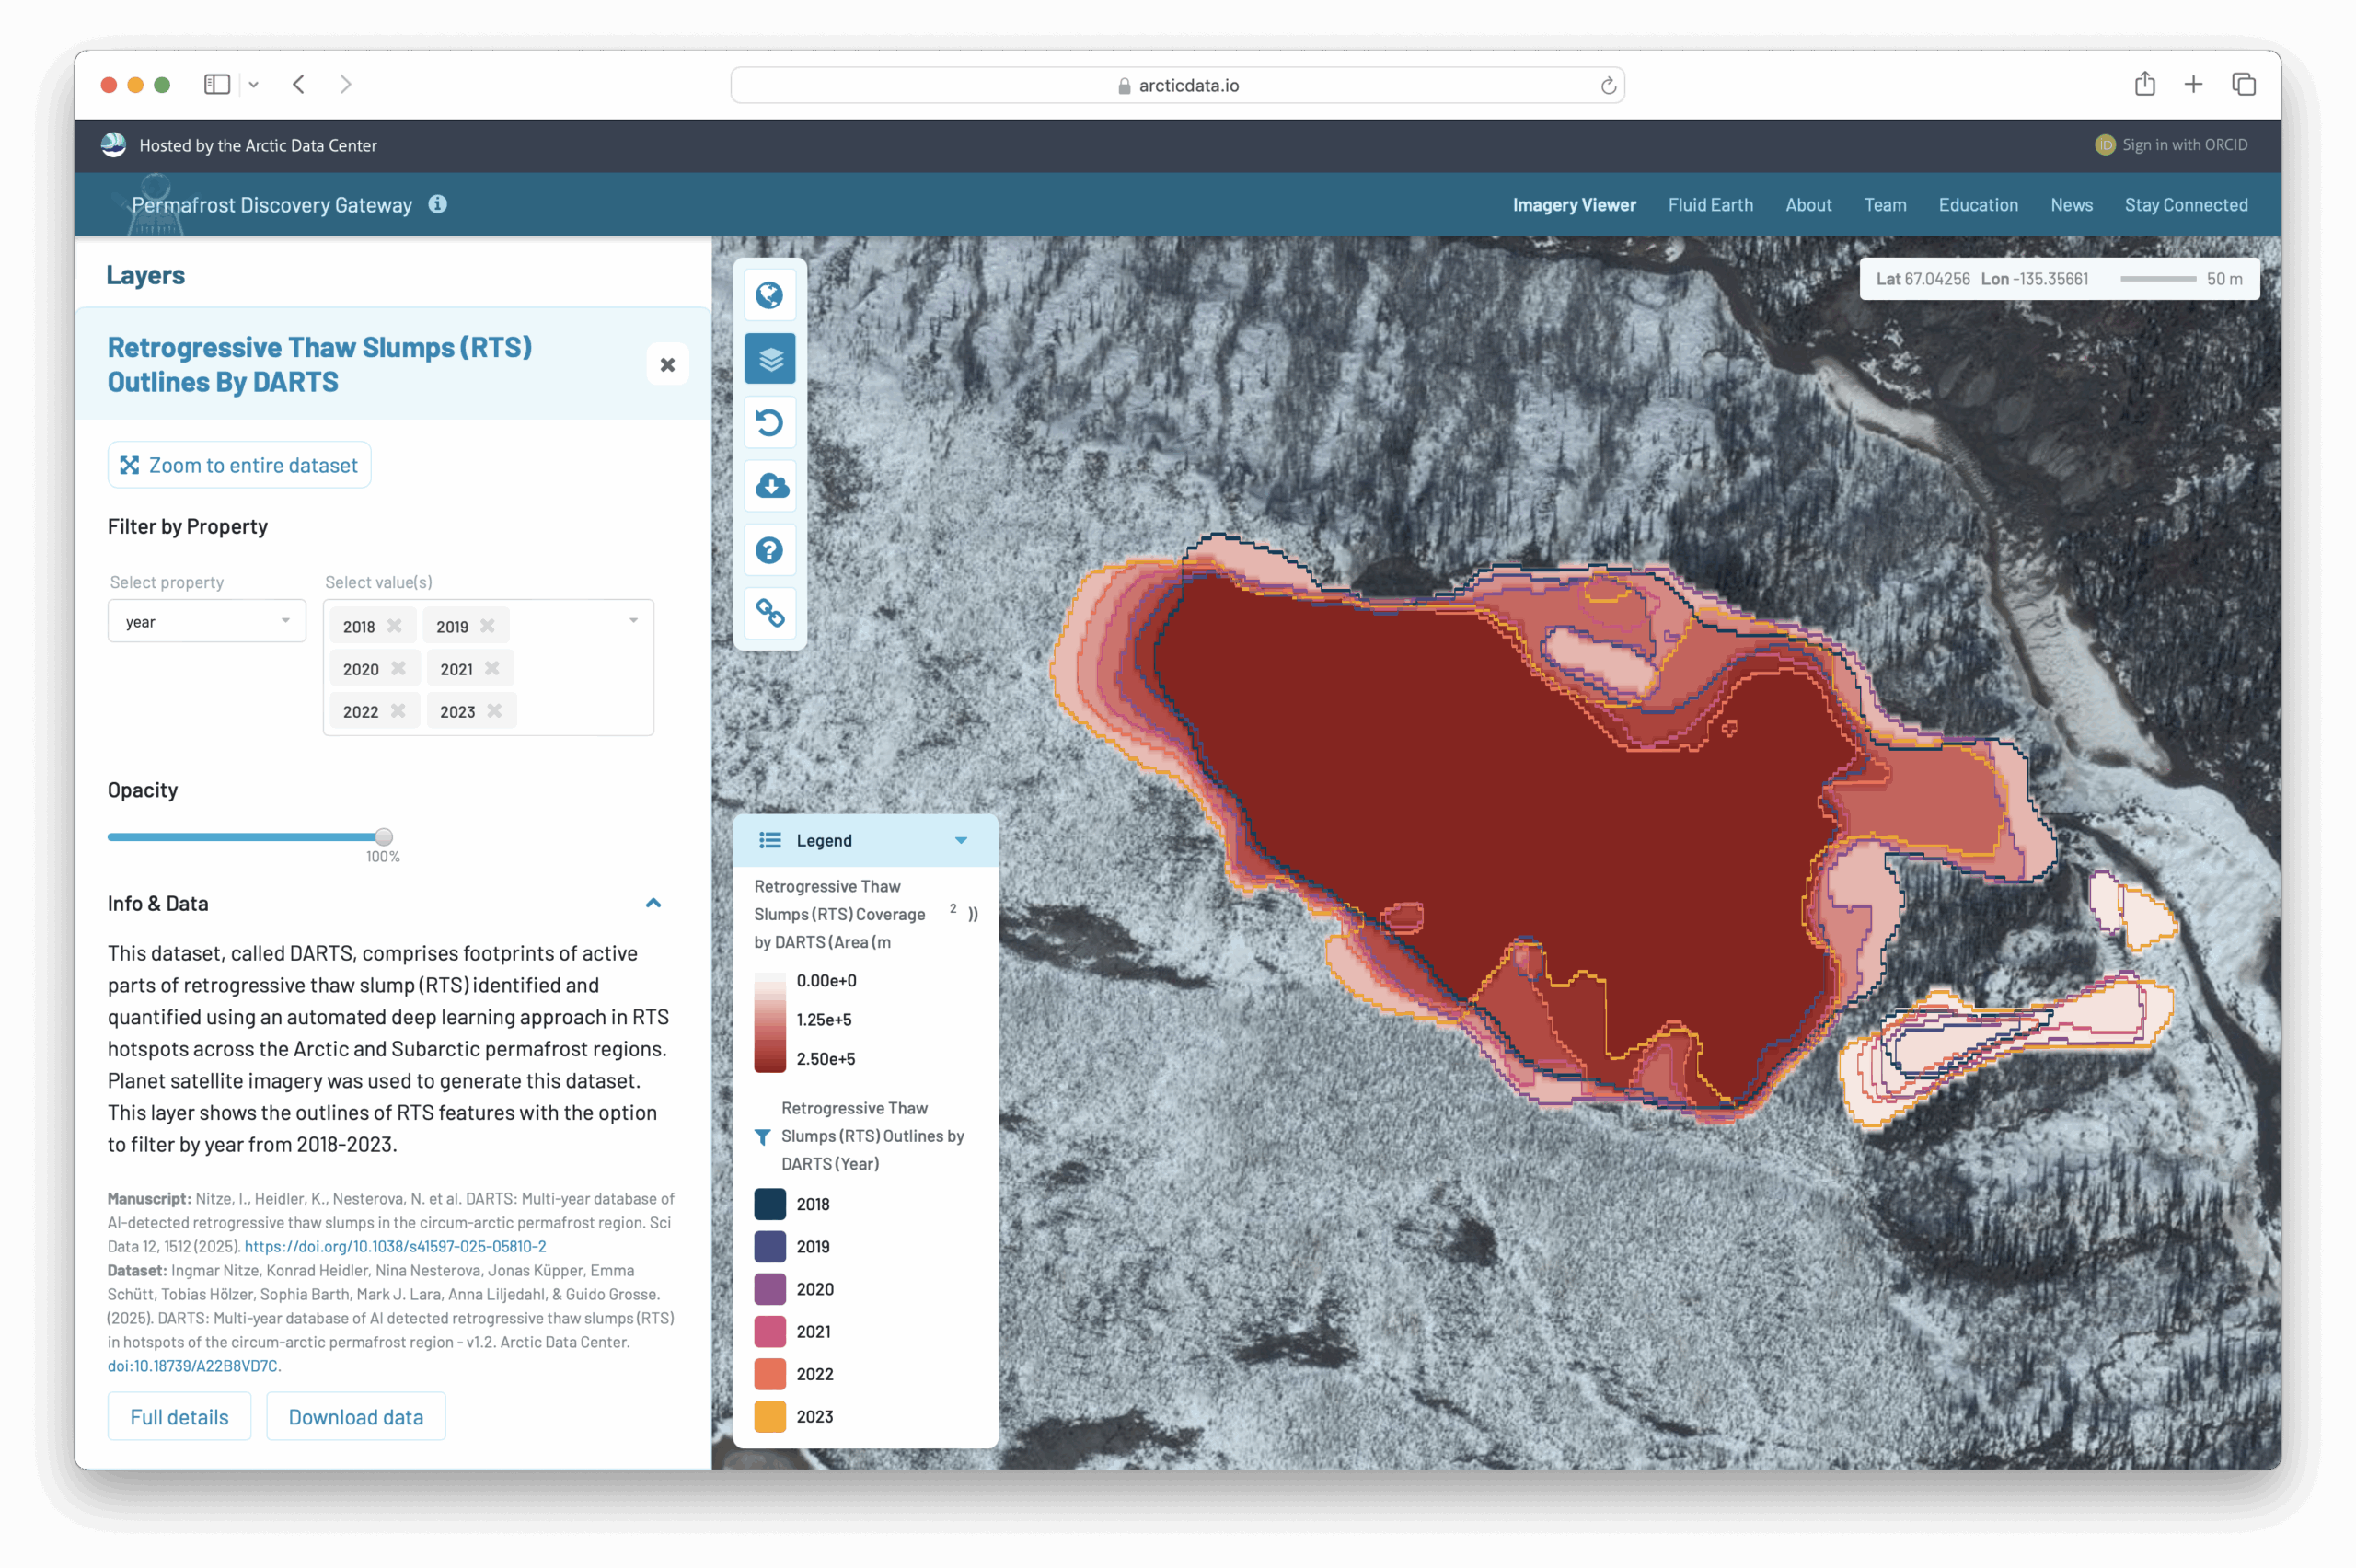
Screenshot of the DARTS dataset in the Permafrost Discovery Gateway portal showing the area coverage of retrogressive thaw slumps in red (m2) and another showing the outlines of each retrogressive thaw slump, filtered by year from 2018 to 2023.
Encouraging Future Scientists
Nitze’s immediate advice for students is simple: ask for internships in research. By reaching out to research groups, organizations, institutes, and others, you can open up many unexpected doors, a sentiment often echoed by other researchers. At the Alfred Wegener Institute, where Nitze is a postdoctoral researcher, he’s seen many students begin their journey with an internship and later return as employees, PhD candidates, or research collaborators.
Beyond mentorship, Nitze notes the power in engaging with open data platforms. He points to PANGAEA, a data publisher for Earth and Environmental Science as a strong resource. While it operates differently than the Arctic Data Center, engaging across both systems could be helpful for emerging scientists. Collaborating through various platforms and teams helps strengthen the broader Arctic research community and ensures more people can access, share, and benefit from the data.
Written by Angie Garcia and Nicole Greco
Community Engagement and Outreach Coordinators