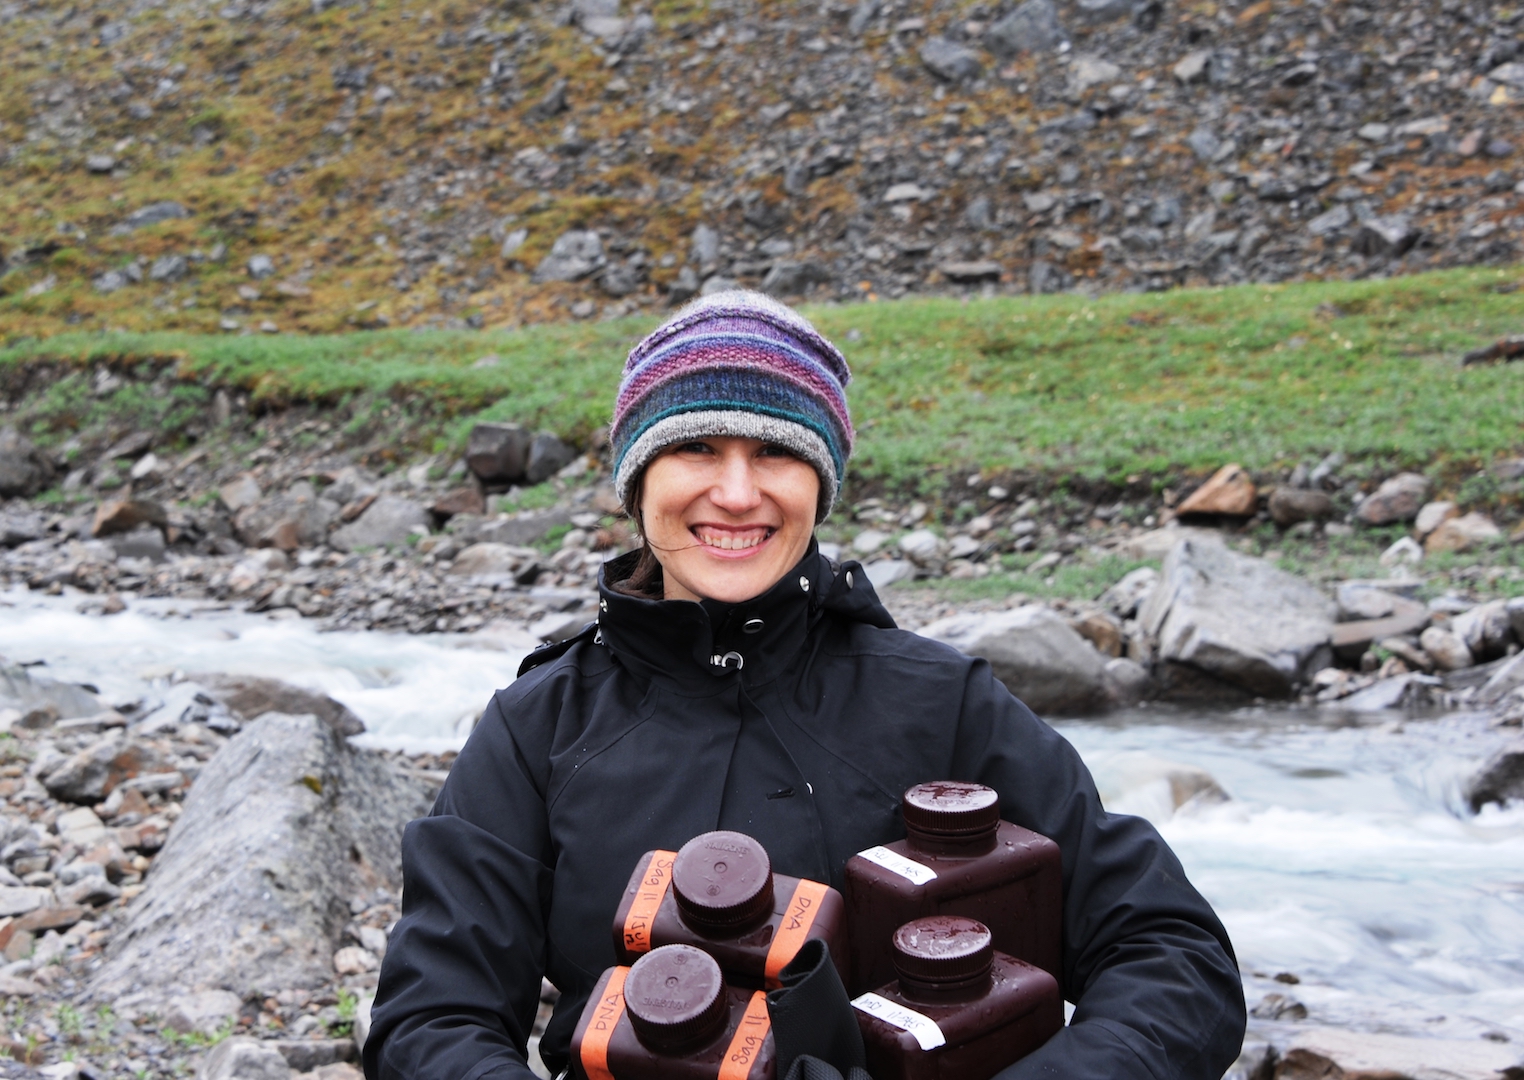
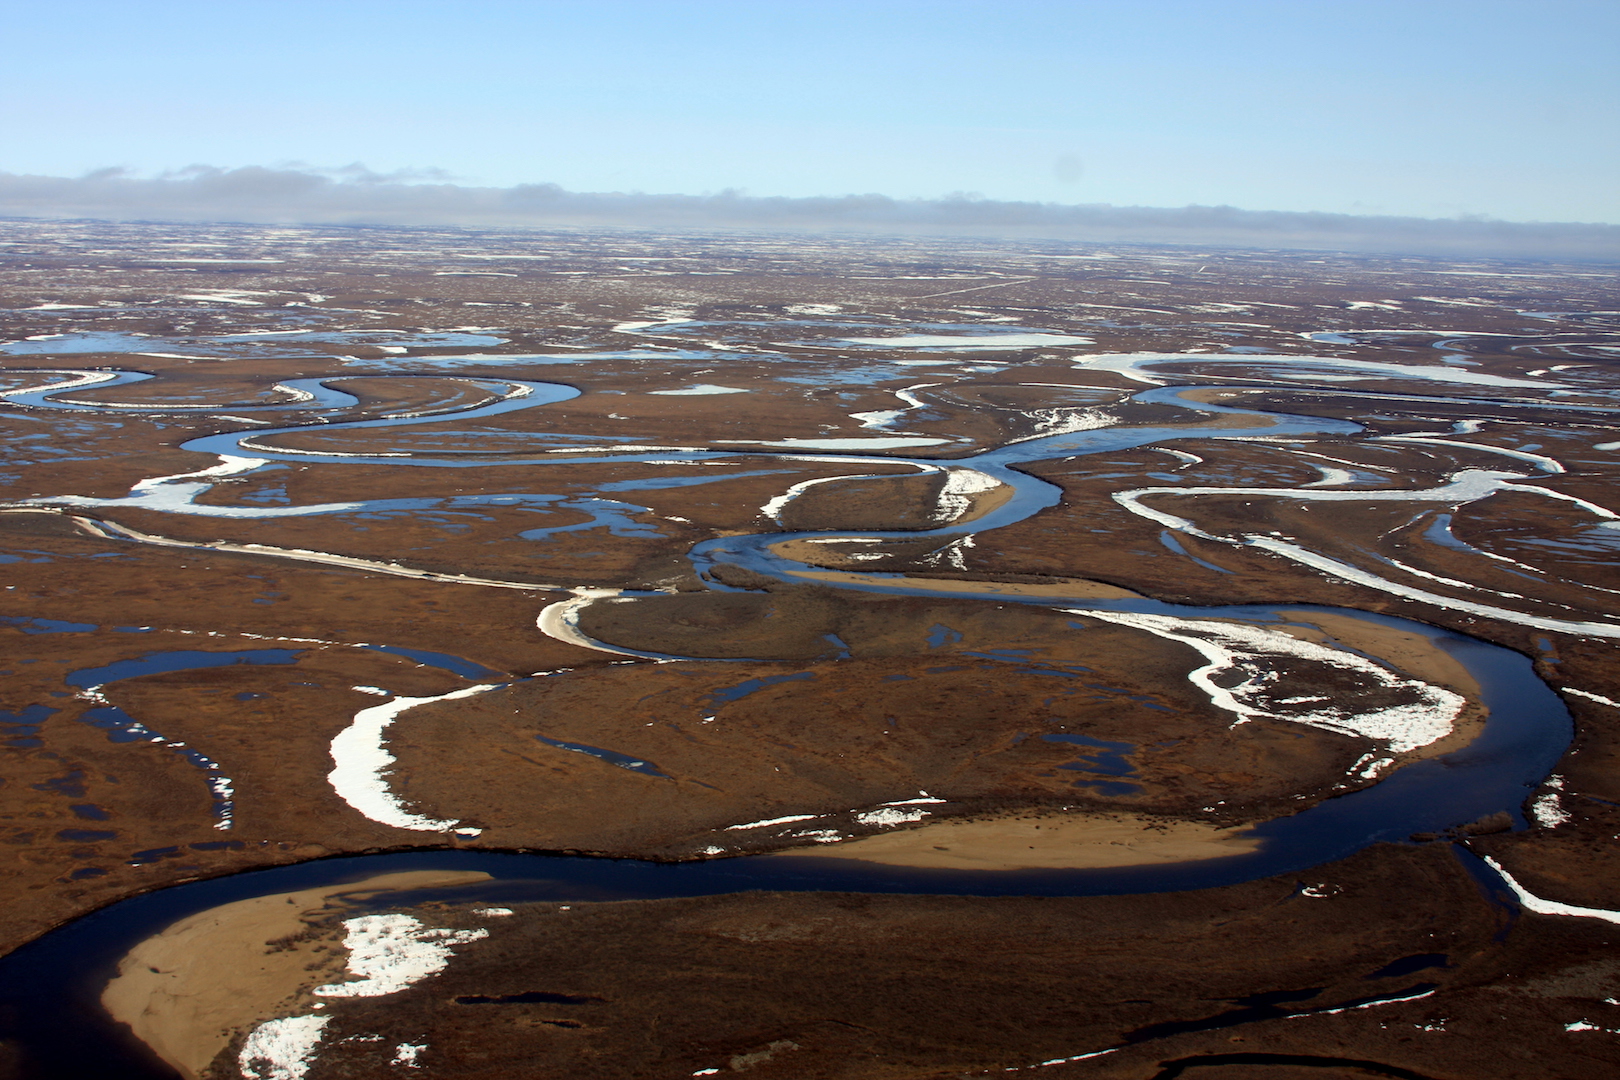
Highlight: This dataset is behind the study recently highlighted in a High Country News article, sharing the work of Dr. Rose Cory and her team.
This dataset is part of a project working to understand what happens to soil organic matter when it’s flushed from soils to streams, ponds and lakes. This organic carbon is mainly dissolved in water, so it’s called “dissolved organic carbon” (DOC). The fate of DOC is to be completely oxidized to carbon dioxide (a greenhouse gas), or partially degraded and transported through rivers to the Arctic Ocean. Dr. Rose Cory, an associate professor at the University of Michigan, and her team are figuring out the processes that control complete and partial oxidation of DOC and quantifying the relative magnitude of these pathways. The results indicate important implications for terrestrial carbon budgets and the ecosystem dynamics of coastal oceans – which is especially important now in the warming Arctic, where vast stores of soil carbon, frozen for thousands of years, may be released into the surface waters.
This dataset uses data collected from 11 sites on the Kuparuk River, from the headwaters in the Brooks Range to its mouth at the Arctic Ocean, covering approximately 350 km of this major river draining the North Slope of Alaska.
Check out the dataset and learn more about the importance and applications of this data in our Q&A with Cory:
What type of data do you collect, and how does it help you answer your research question?
RC: We collect river water chemistry. Specifically for this project we’re studying the chemistry of the dissolved organic carbon (DOC) in the river water. We bring the river water we collect back to Toolik Field Station (Alaska) and conduct experiments to measure how easily the DOC in the water is oxidized to carbon dioxide and other molecules by sunlight. We also measure how partial oxidation of DOC by sunlight influences how well microbes can decompose the remaining DOC. We combine our experimental results with river water chemistry data and the amount of sunlight reaching the river surface to estimate the carbon dioxide produced by sunlight-driven (photochemical) oxidation of DOC all along the Kuparuk River.
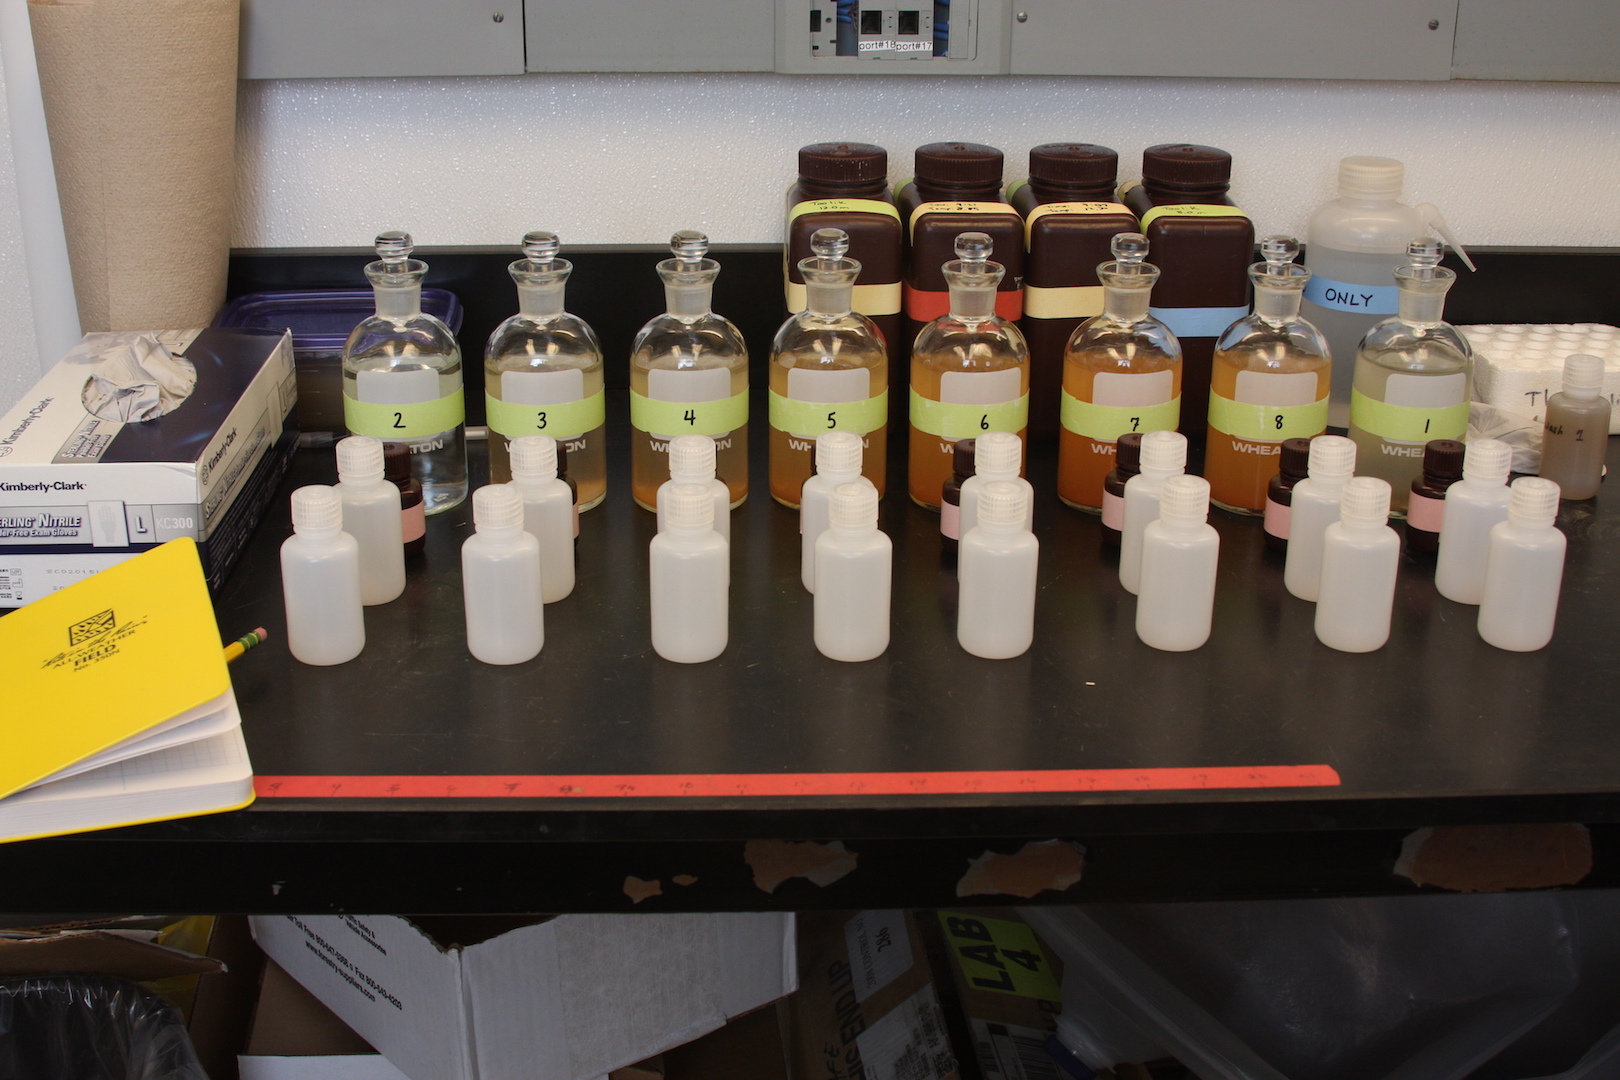
Laboratory work at Toolik Field Station includes many sample bottles for the characterization of the water chemistry in the Kuparuk River. Photo credit: Jason Dobkowski
Who do you think would benefit most by having access to your data?
RC: Any scientist interested in carbon cycling in inland or coastal waters, or the movement of soil carbon from land to water.
What other data do you depend on to help you address your research question, and where do you find this data?
RC: One big component of the work is knowing how much ultra-violet light (UV) from sunlight reaches the Kuparuk River at any moment in time. Sensors are expensive and difficult to maintain, so we often rely on modeled UV data (such as from the National Center for Atmospheric Research tropospheric UV). We also need to know about the hydrology of the Kuparuk River, such as how wide and deep is the river and is the water slowly meandering or rushing through the river? A wide, slowly moving river may mean more opportunities for DOC oxidation to carbon dioxide by sunlight, for example. We are collaborating with a hydrologist, Beth Neilson at Utah State, and her team to combine our chemistry with the hydrology.
What are the data telling you so far?
RC: We’ve found that sunlight-driven (photochemical) oxidation of DOC to carbon dioxide is more important to inland water carbon budgets and greenhouse gas emissions than expected. The assumption was that biological processes were much more important than sunlight in oxidizing DOC. This discovery was published in Cory et al. 2014 and was recently described in a story (with great photos) in High Country News. Now what we’re trying to understand are the details of photochemical oxidation of DOC, such as why does the reactivity of DOC to sunlight change as water moves downstream in the Kuparuk River from the mountains to the coast? What we’re finding is that the DOC reactivity to sunlight changes with distance downstream in the Kuparuk River due to (a) inputs of “new” DOC from soils or from tributaries that enter the river, (b) degree of prior photochemical and biological oxidation of DOC in the river.
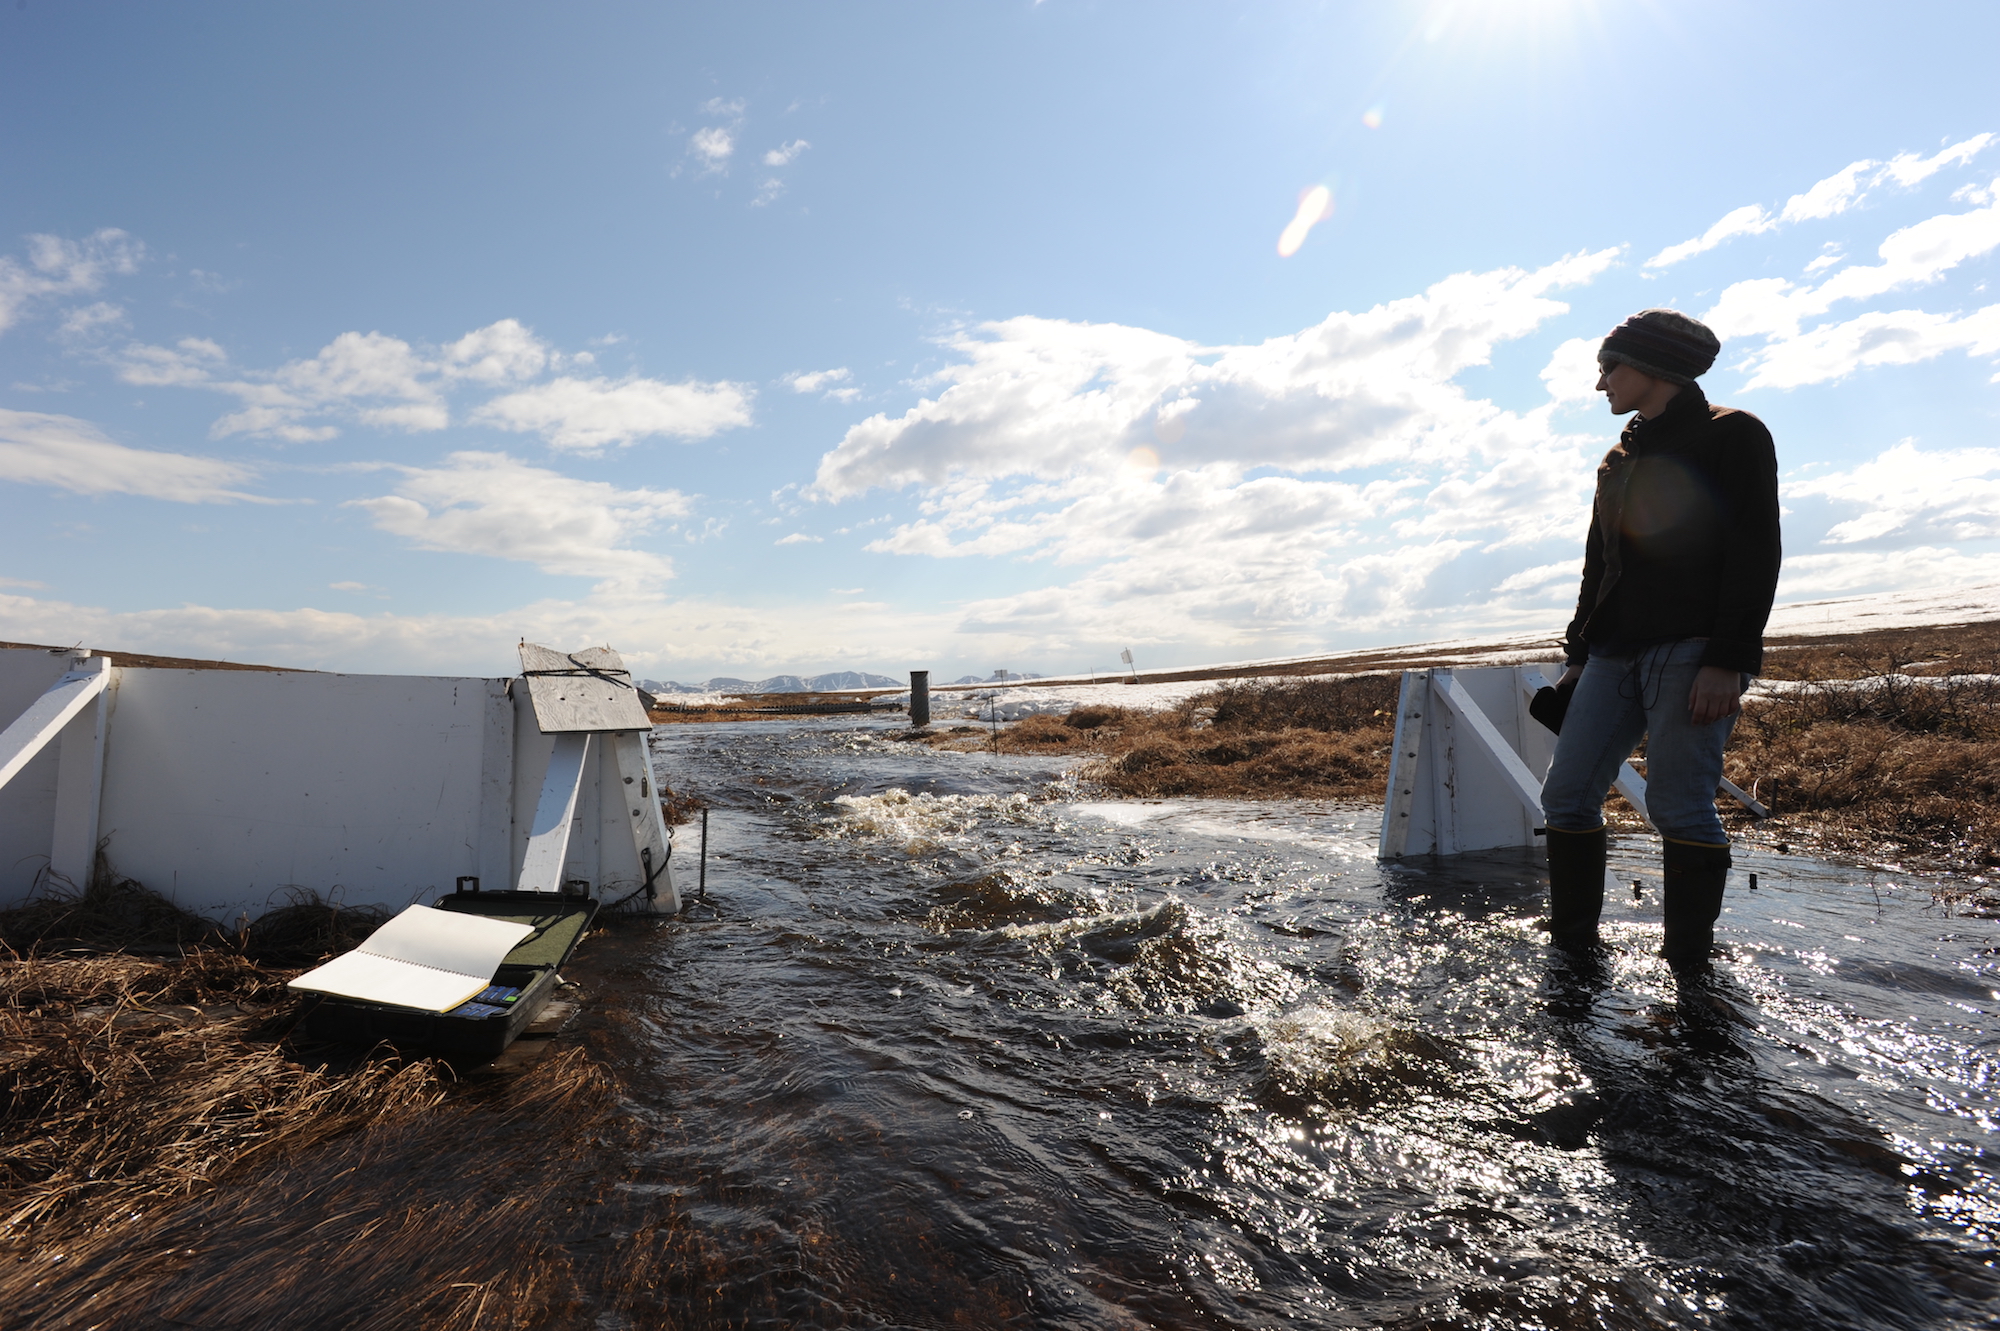
Rose Cory at Imnavait Creek (May, 2011) a stream that drains into the Kuparuk River. Photo Credit: G.W. Kling
What is one way your data are being applied to address issues in the Arctic?
RC: Climate change in the Arctic is progressing rapidly, warming and thawing large areas of permafrost that contain nearly half of the world’s soil organic carbon. Conversion of this carbon pool to greenhouse gases has the potential to double the amount of carbon dioxide in the atmosphere on a timescale similar to human inputs of greenhouse gases to the atmosphere. But soil carbon stored in the permafrost carbon must be unfrozen, dissolved, and oxidized before it can feedback to the atmosphere as carbon dioxide. Our study is determining and quantifying controls on the oxidation of DOC to carbon dioxide, focusing specifically on the interaction between microbial and sunlight (photochemical) oxidation.
What data tool or aspect of data sharing/storage would you most like to see developed or further implemented in the arctic research field?
RC: I would love to have access to satellite products that could be combined with our field work to scale up some of our results across larger areas of the Arctic than we can sample directly. Also, it would be great to have better coverage or models of UV reaching the surface across the Arctic. There is little data available for surface UV across the Arctic, and cloud cover decreases the accuracy of model predictions of UV reaching surface waters.
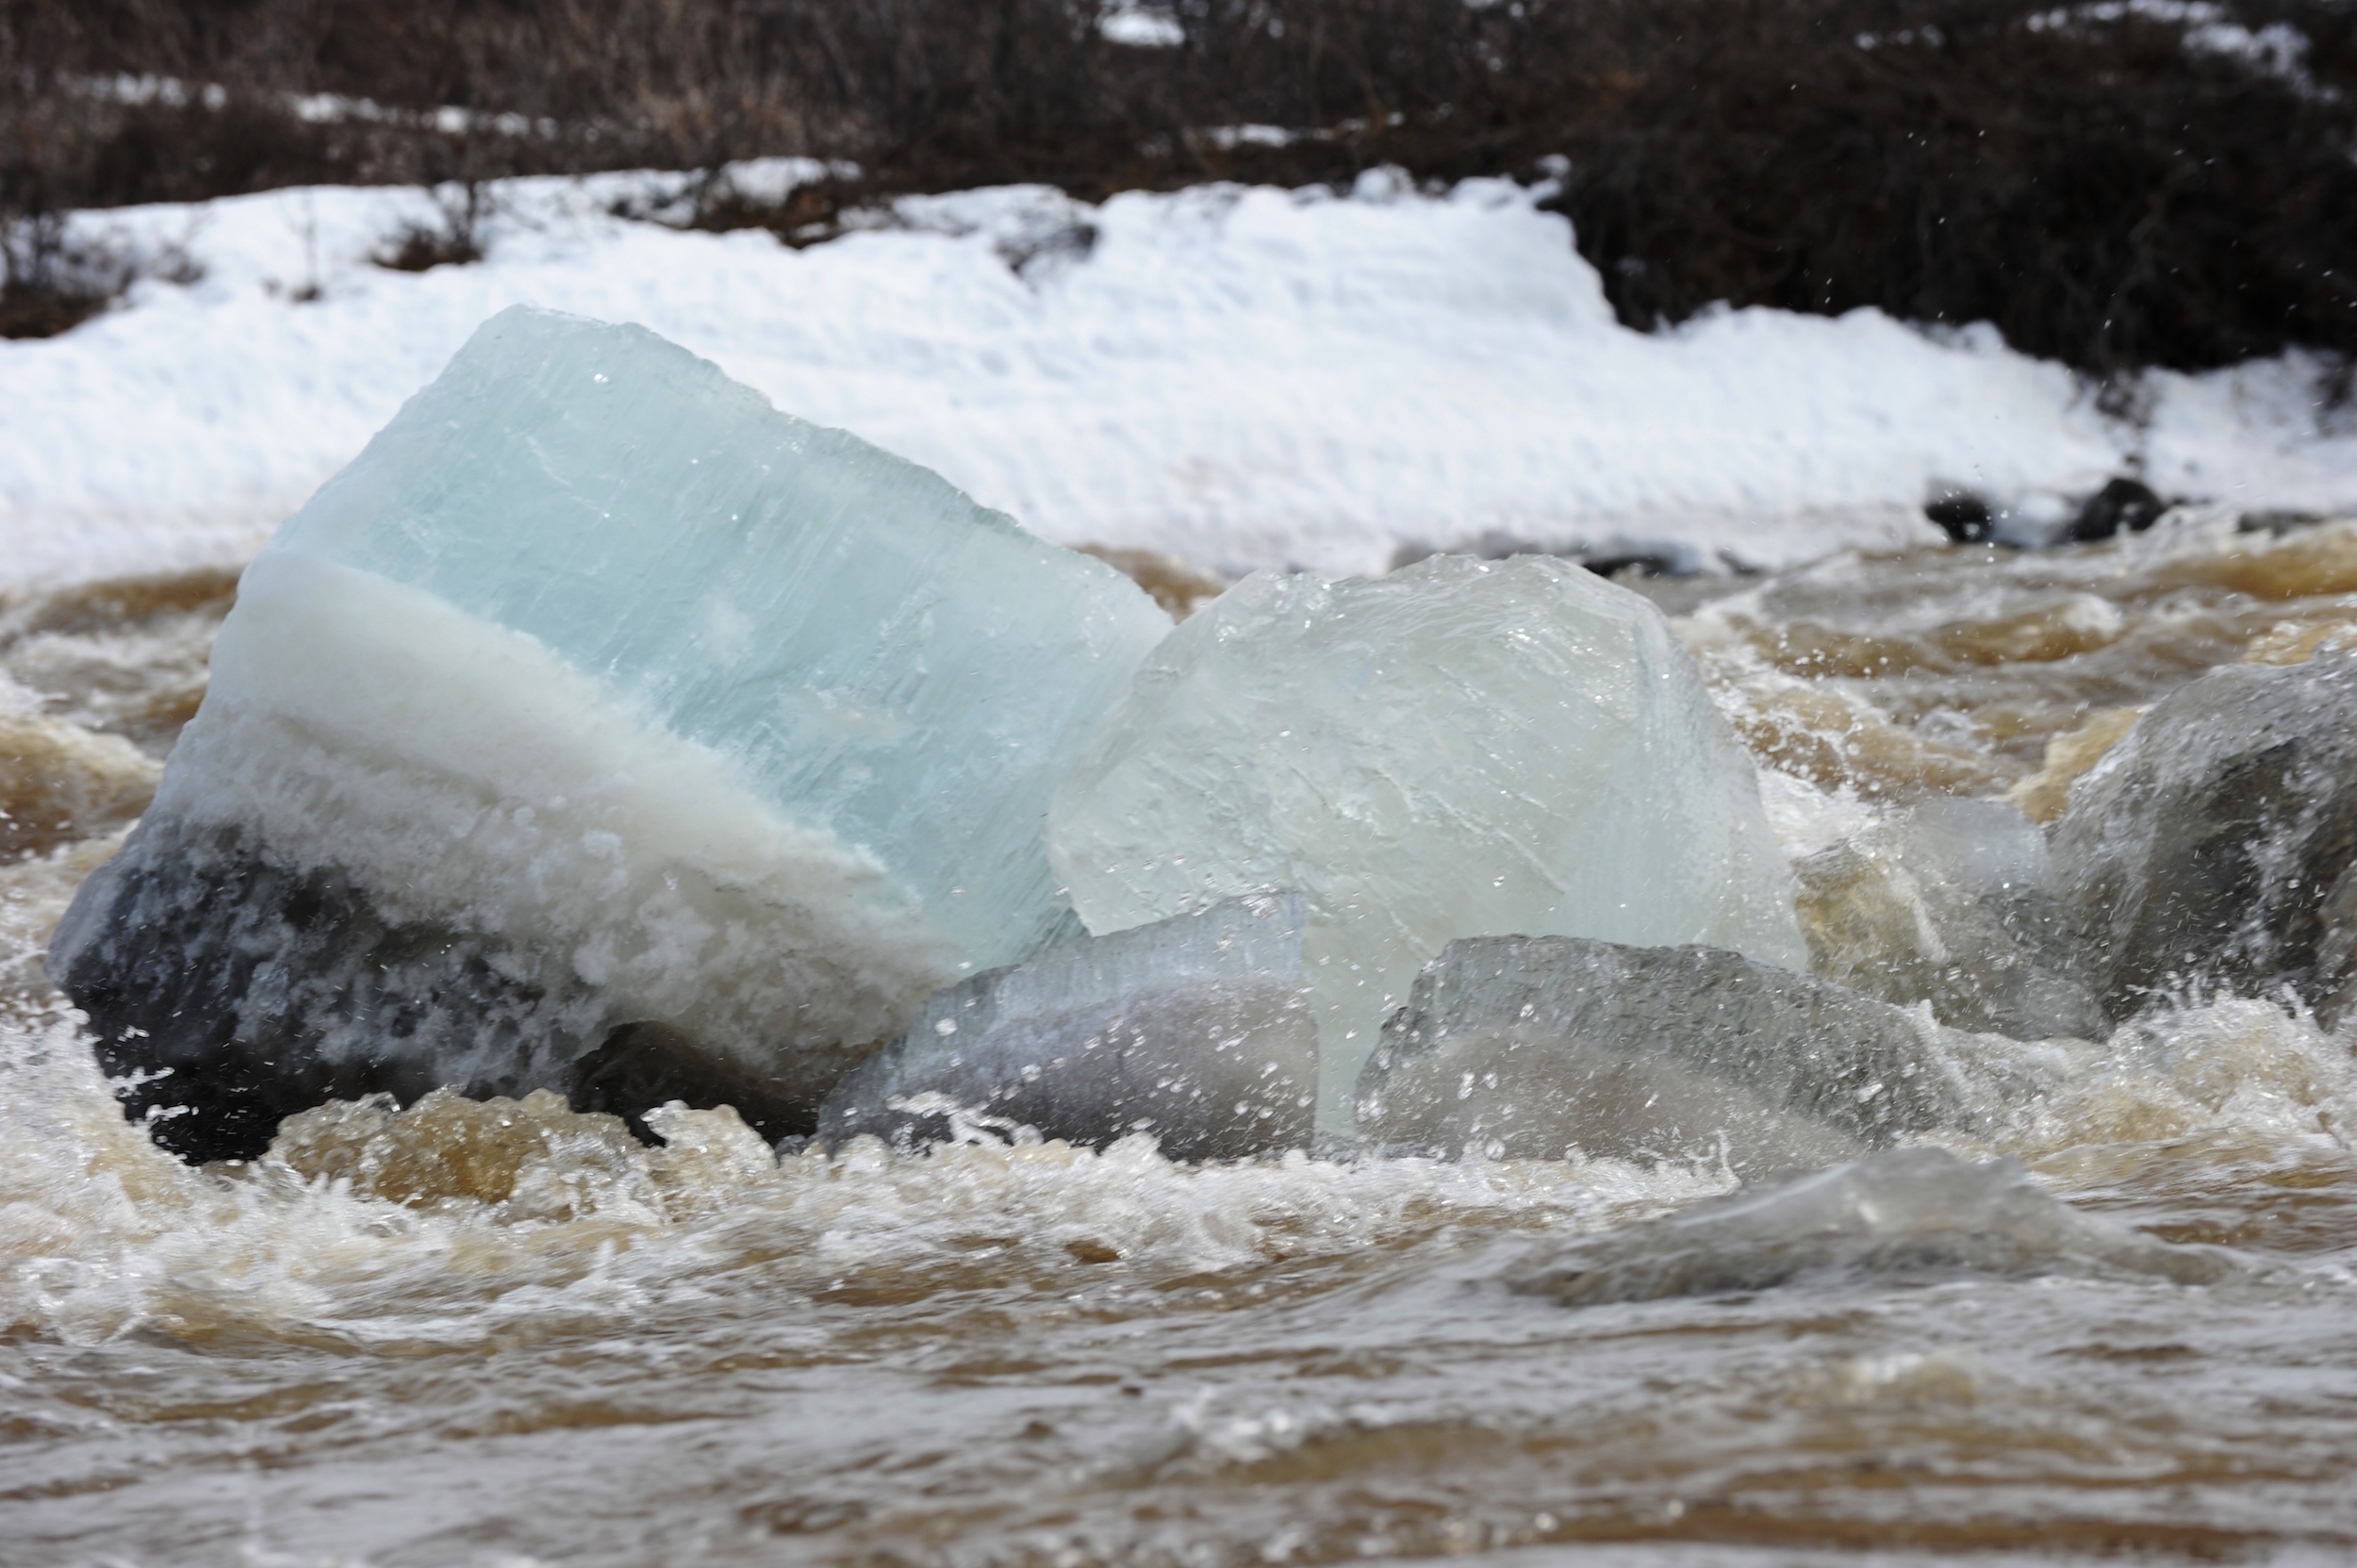
Spring thaw is a loud and dramatic kaleidoscope of color and cacophony of sound as shown here in this river where huge blocks of ice crash downstream in roaring river water. Photo credit: Rose Cory
How can your data be applied by others to address more arctic research questions?
RC: Scientists interested in inland water carbon cycling could use the data to test ideas on carbon processing in rivers (some of these ideas are outlined in a recent Limnology and Oceanography Letters “current evidence” paper).
What is one of your favorite places in the Arctic?
RC: All of them. But I do have a favorite event in the Arctic: spring thaw. Spring thaw is high drama for an aquatic geochemist because it is loud, fast, and glittery, a major contrast to the silent, long, dark, winter. Before thaw around late May, the landscape is covered in snow, which looks to me like a perfect layer of white fondant frosting. Then, pockets of snow melt to form tiny streams. These streams dissolve soil organic carbon (DOC), leading to glittery root-beer colored water (the root beer color comes from the sunlight-absorbing DOC dissolved by snowmelt, and the “glitter” comes from the sunlight reflecting off the water and snow). The root-beer colored streams carve through snow towards frozen rivers, where the ice there is starting to melt often in very dramatic fashion with arm-chair-sized ice “cubes” crashing and smashing their way downstream, roaring towards the Arctic Ocean. Sometimes these river ice-cubes look like turquoise or onyx due to sunlight bouncing off the minerals or (black) dust trapped in the water when it froze last season. Spring thaw is really a beautiful kaleidoscope of color and cacophony of sound, and there is no better place to be!
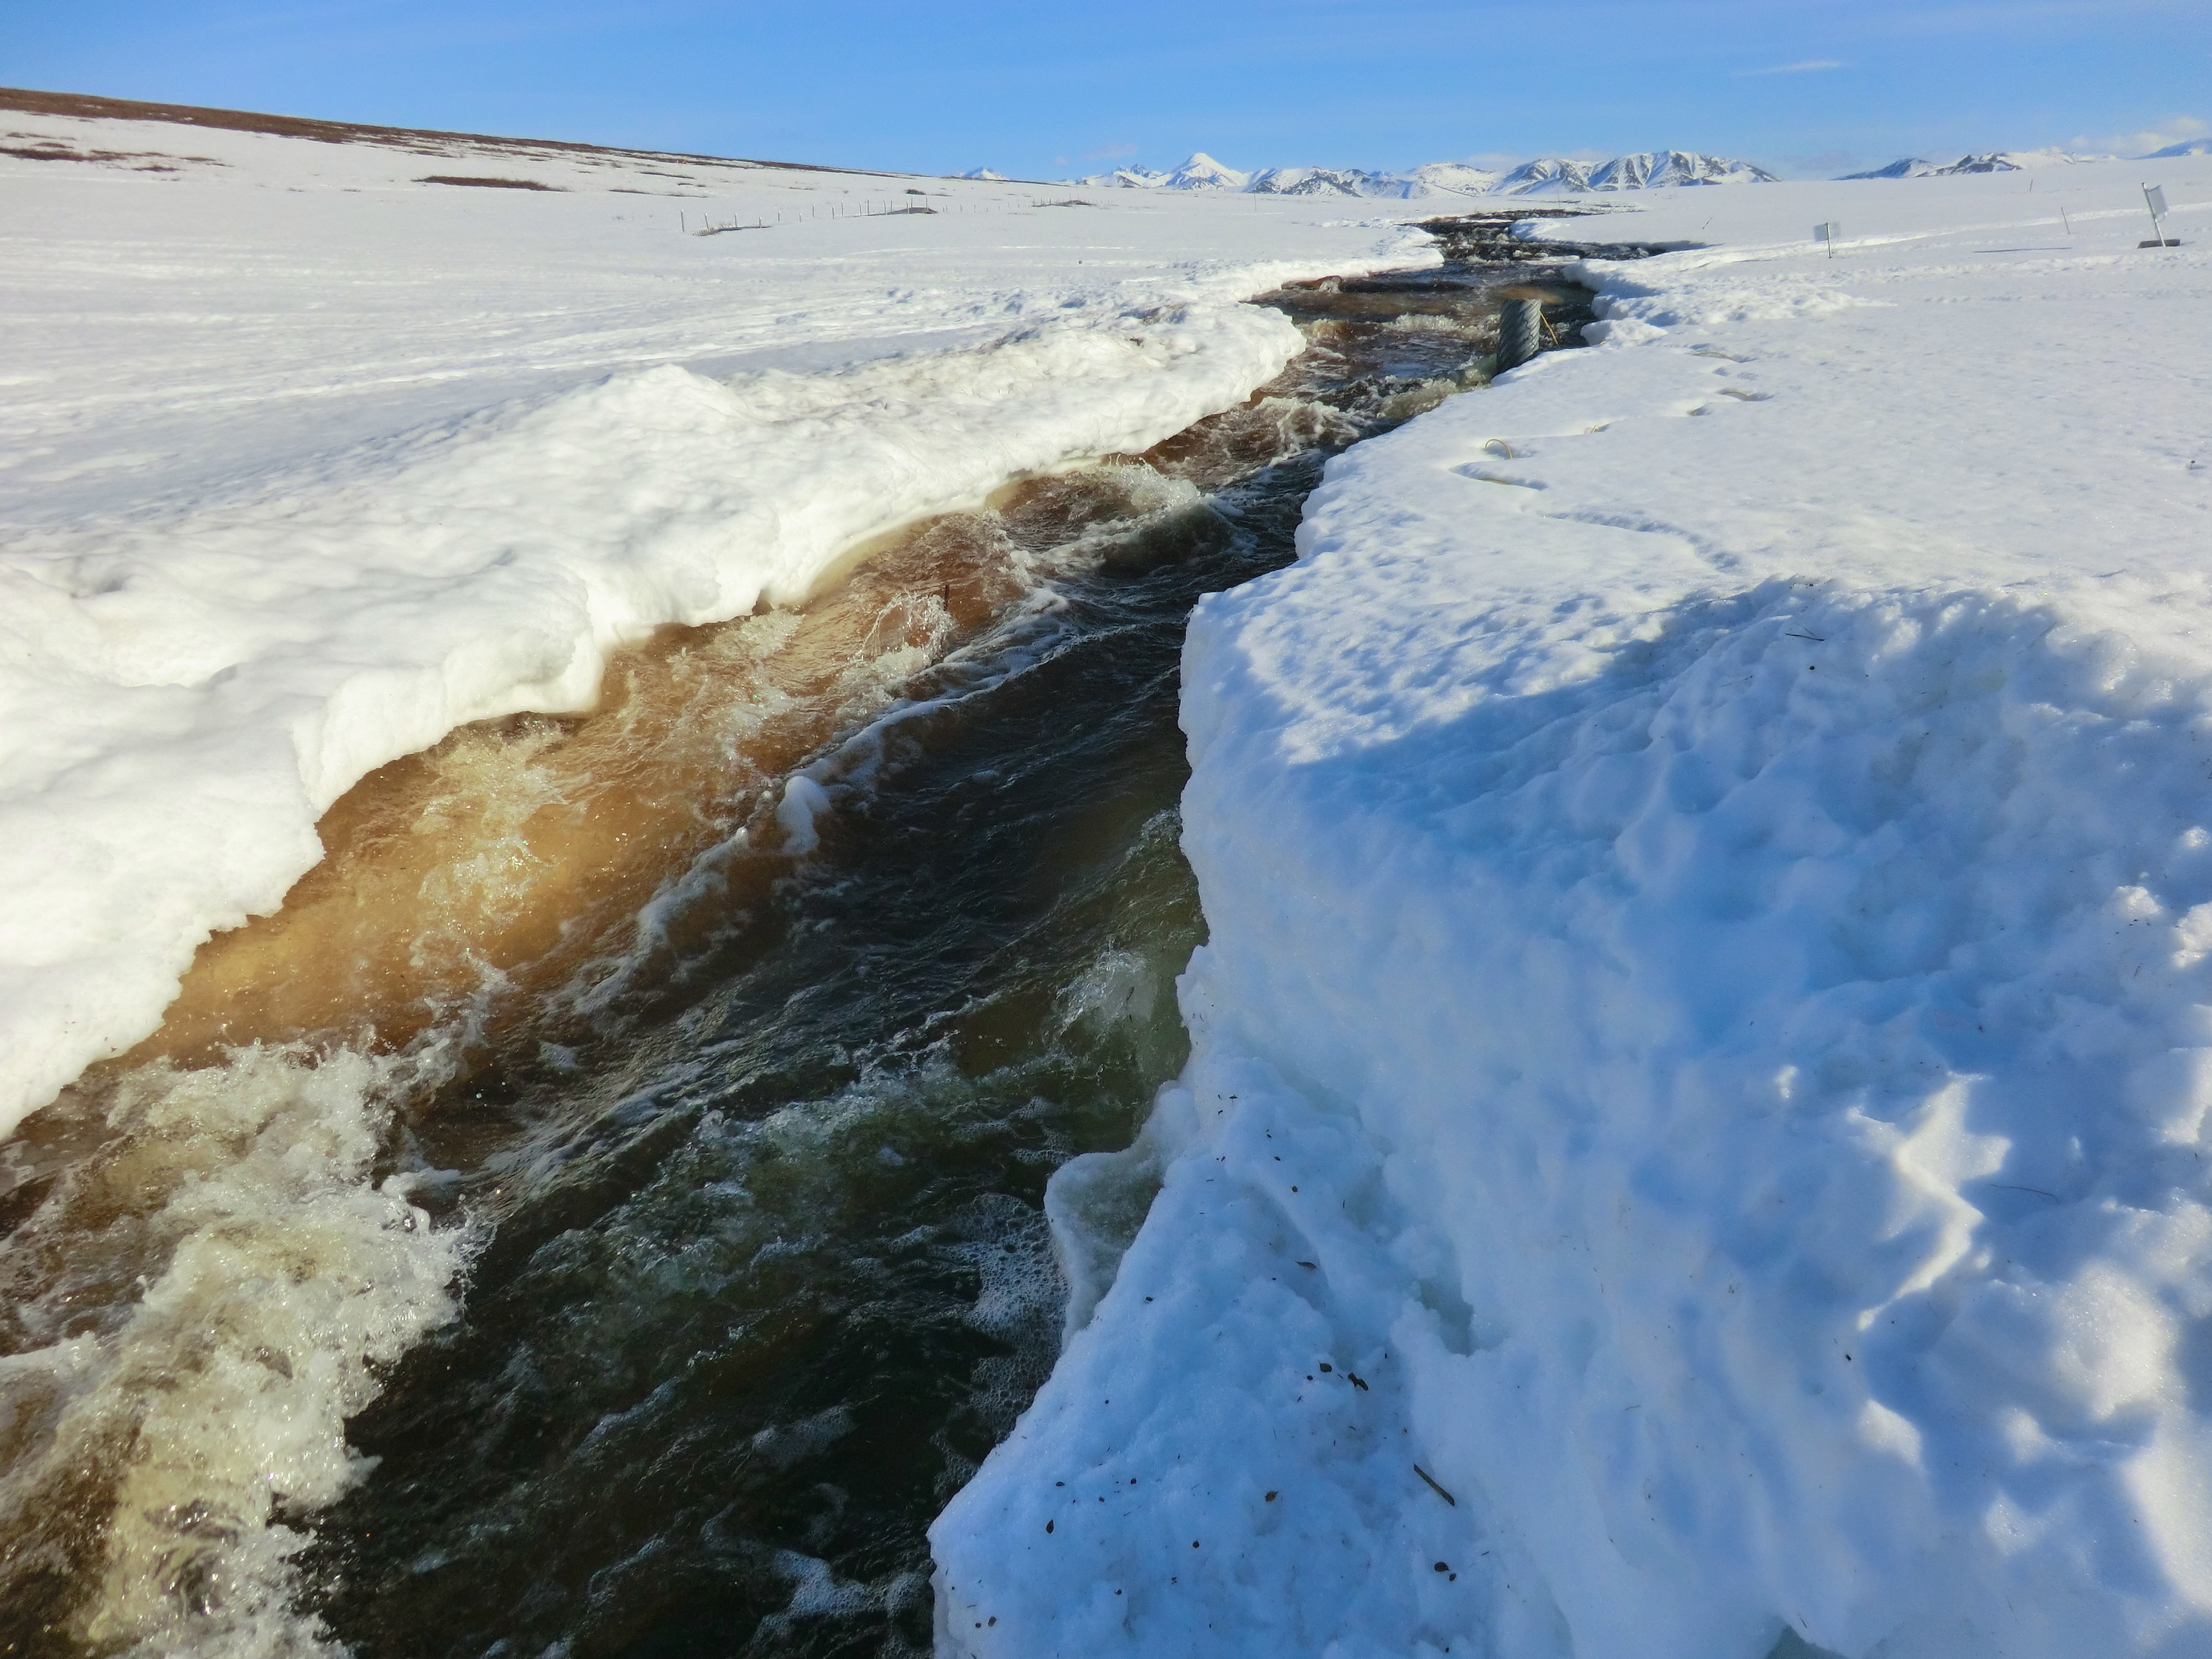
Spring thaw and snowmelt in the Alaskan Arctic leads to root-beer colored water (the root beer color comes from the sunlight-absorbing organic carbon dissolved by snowmelt running over the soil). The root-beer colored streams carve through melting snow. All along the way the organic carbon in the water is absorbing sunlight and in the processing can be converted to carbon dioxide, a greenhouse gas. Photo credit: Jason Dobkowski
Citation: Rose Cory. 2017. Kuparuk River photo-bio apparent quantum yield, Alaska, 2011-2012. Arctic Data Center. doi:10.18739/A2SV8Z.
By Kathryn Meyer

