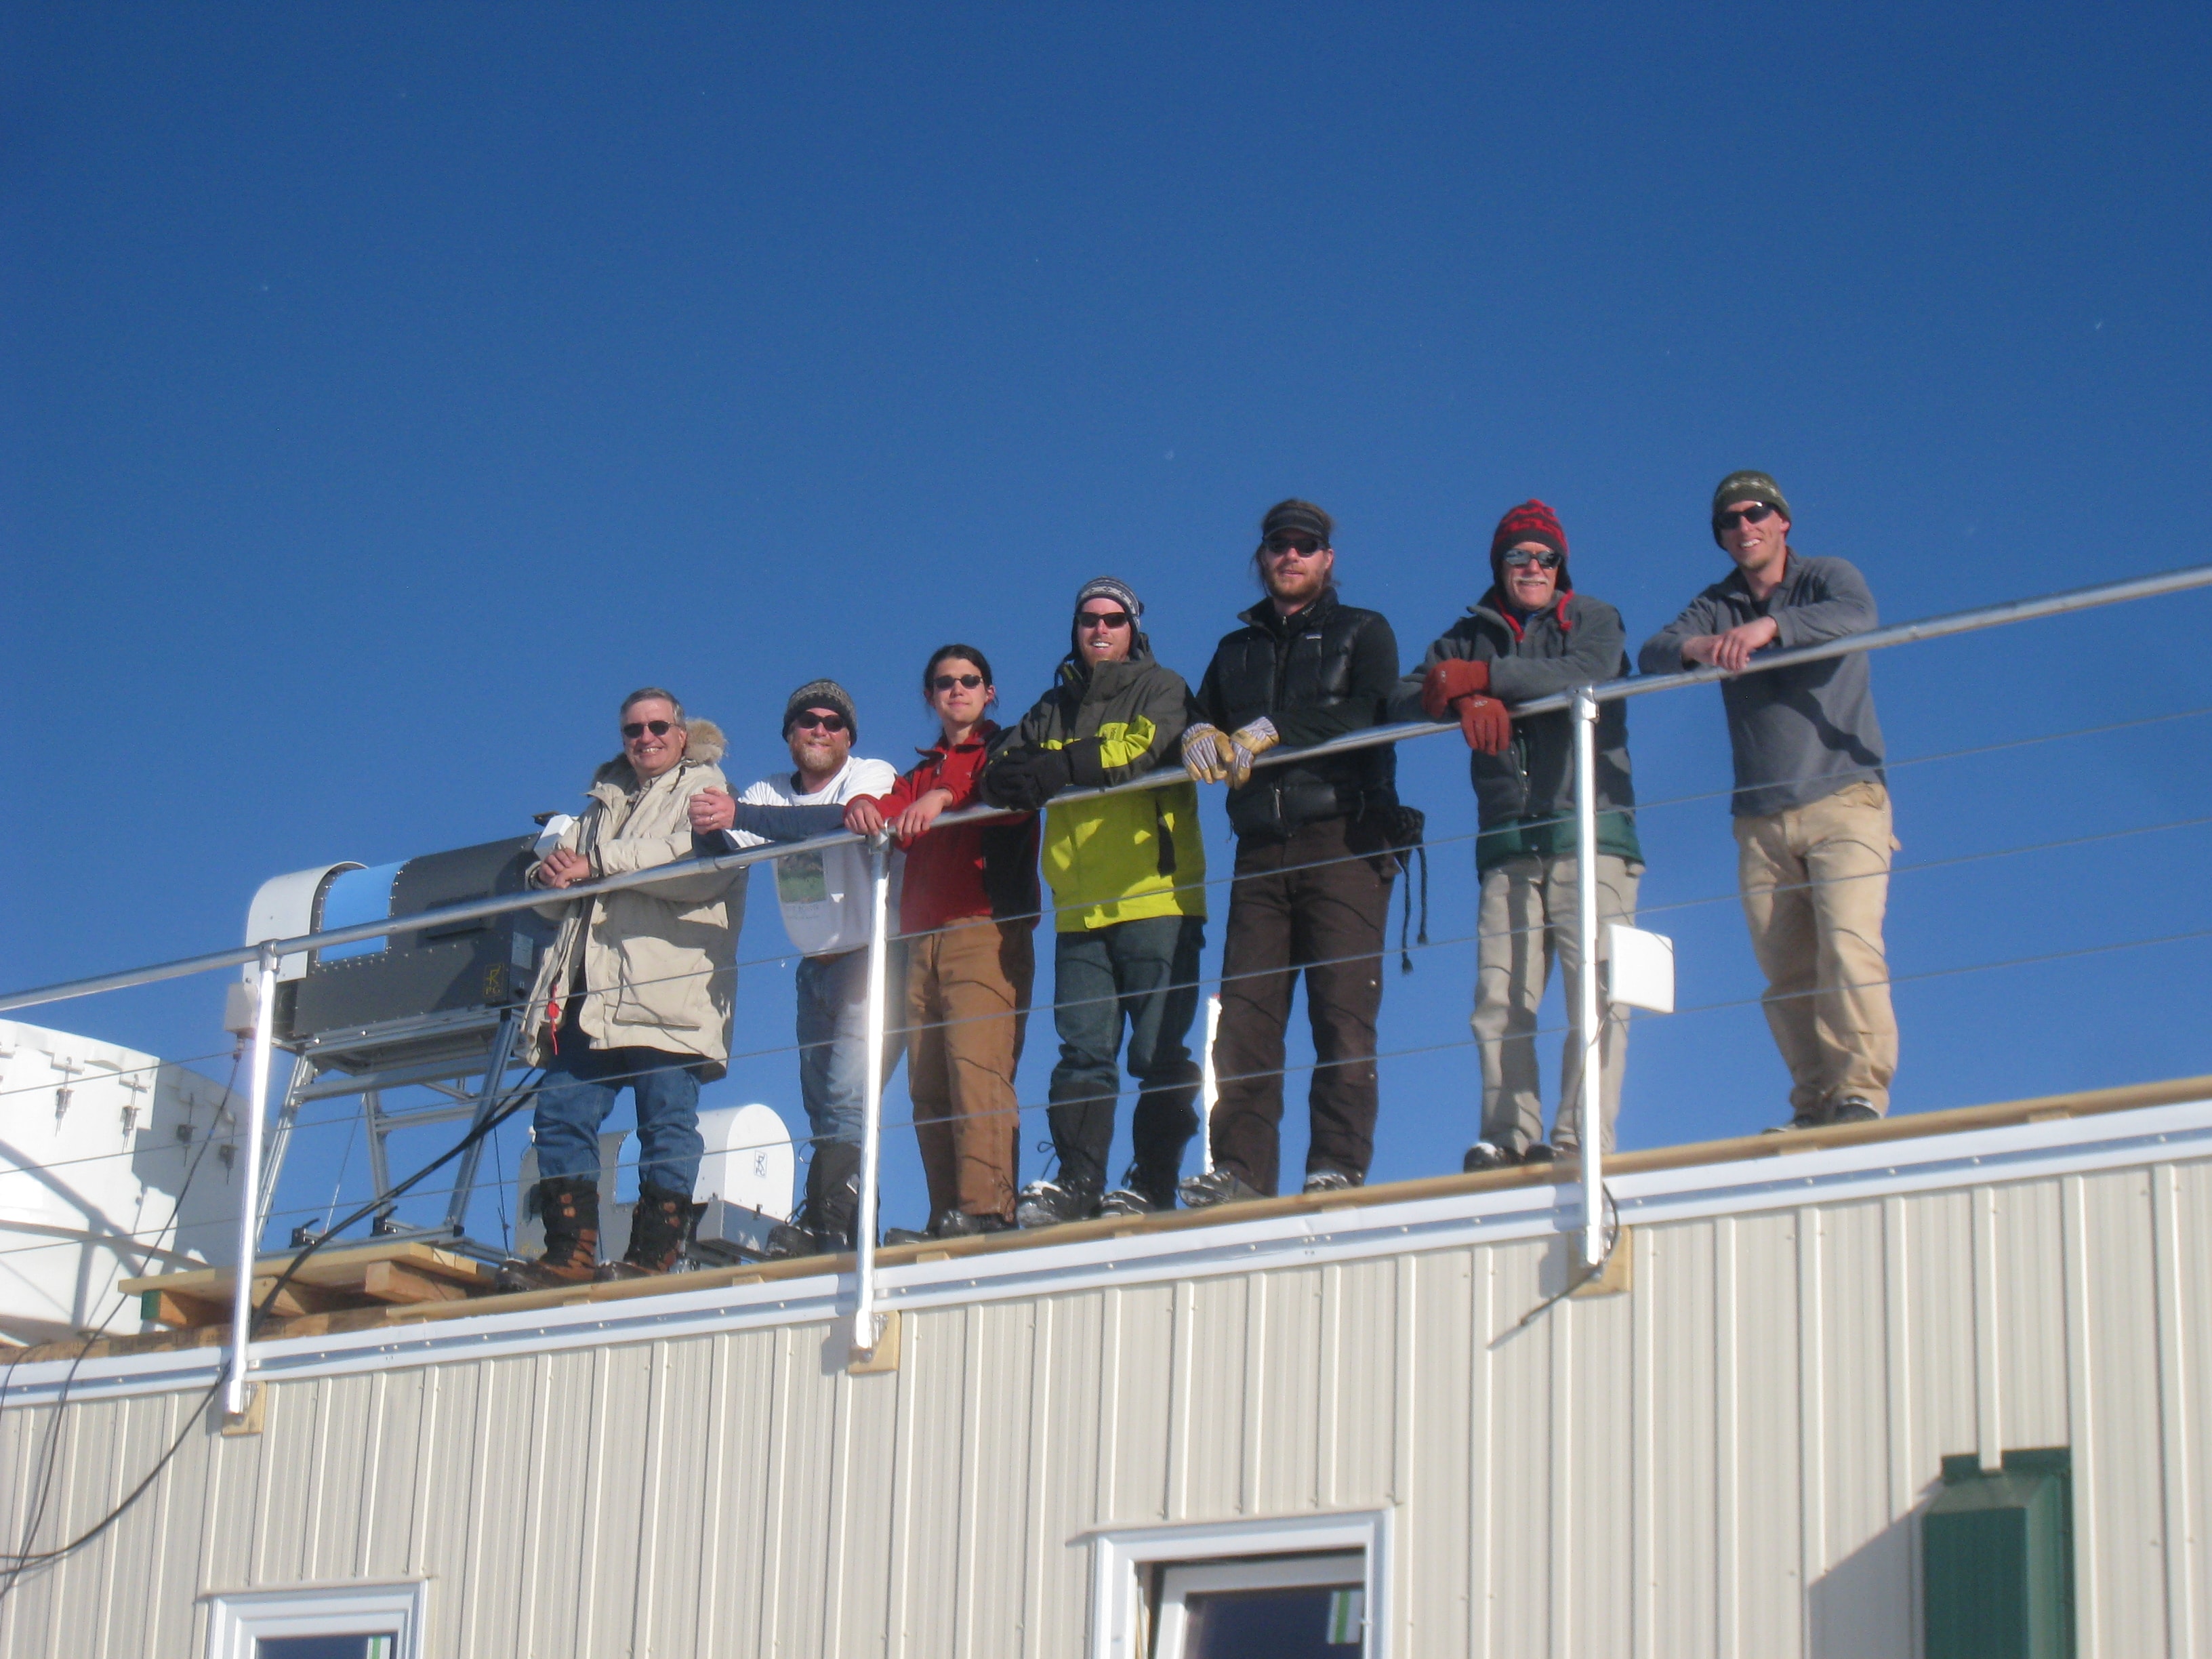
Members of the ICECAPS project team at the station in Summit, Greenland (L-R: Duane Hazen, Michael O’Neill, Ryan Neely, Erik Olson, Matthew Shupe, Brad Halter, and Christopher Cox). Picture Courtesy: Matthew Shupe
Highlight: “ICECAPS data and analyses have developed process relationships that relate cloud variability to different terms of the surface energy budget as a function of time of year. These relationships are used to assess large-scale models and identify specific model deficiencies that must be addressed to accurately represent the energy partitioning at Greenland’s surface,” – Dr. Matthew Shupe.
Summit Station, Greenland, located in the middle of the Greenland Ice Sheet, is the Arctic’s highest altitude year-round operational research station. It’s also the location of the Integrated Characterization of Energy, Clouds, Atmospheric State and Precipitation at Summit (ICECAPS) project. The ICECAPS project is designed to address five primary research questions:
- What are the characteristics of the atmospheric state and clouds over Summit, Greenland? And how do these characteristics vary at different time scales (daily, monthly, seasonal, and inter-annually)?
- What are the effects of clouds and atmospheric state on the surface radiation budget and the atmospheric radiative heating profile at Summit, Greenland?
- How do the interactions among stratiform clouds, radiation, and the atmospheric structure determine the cloud-phase partitioning and sustain cloud layers over long time periods?
- How are cloud and precipitation properties at Summit, Greenland, associated with local and regional weather and climate variables, including winds, temperature, turbulent heat fluxes, radiative fluxes, and synoptic (general meteorological condition) activity?
- How do cloud, radiation, and atmospheric state properties and processes vary at different Arctic atmospheric observatory locations (i.e., Barrow, Alaska; Eureka, Nunavut, Canada; and Summit, Greenland, etc.)?
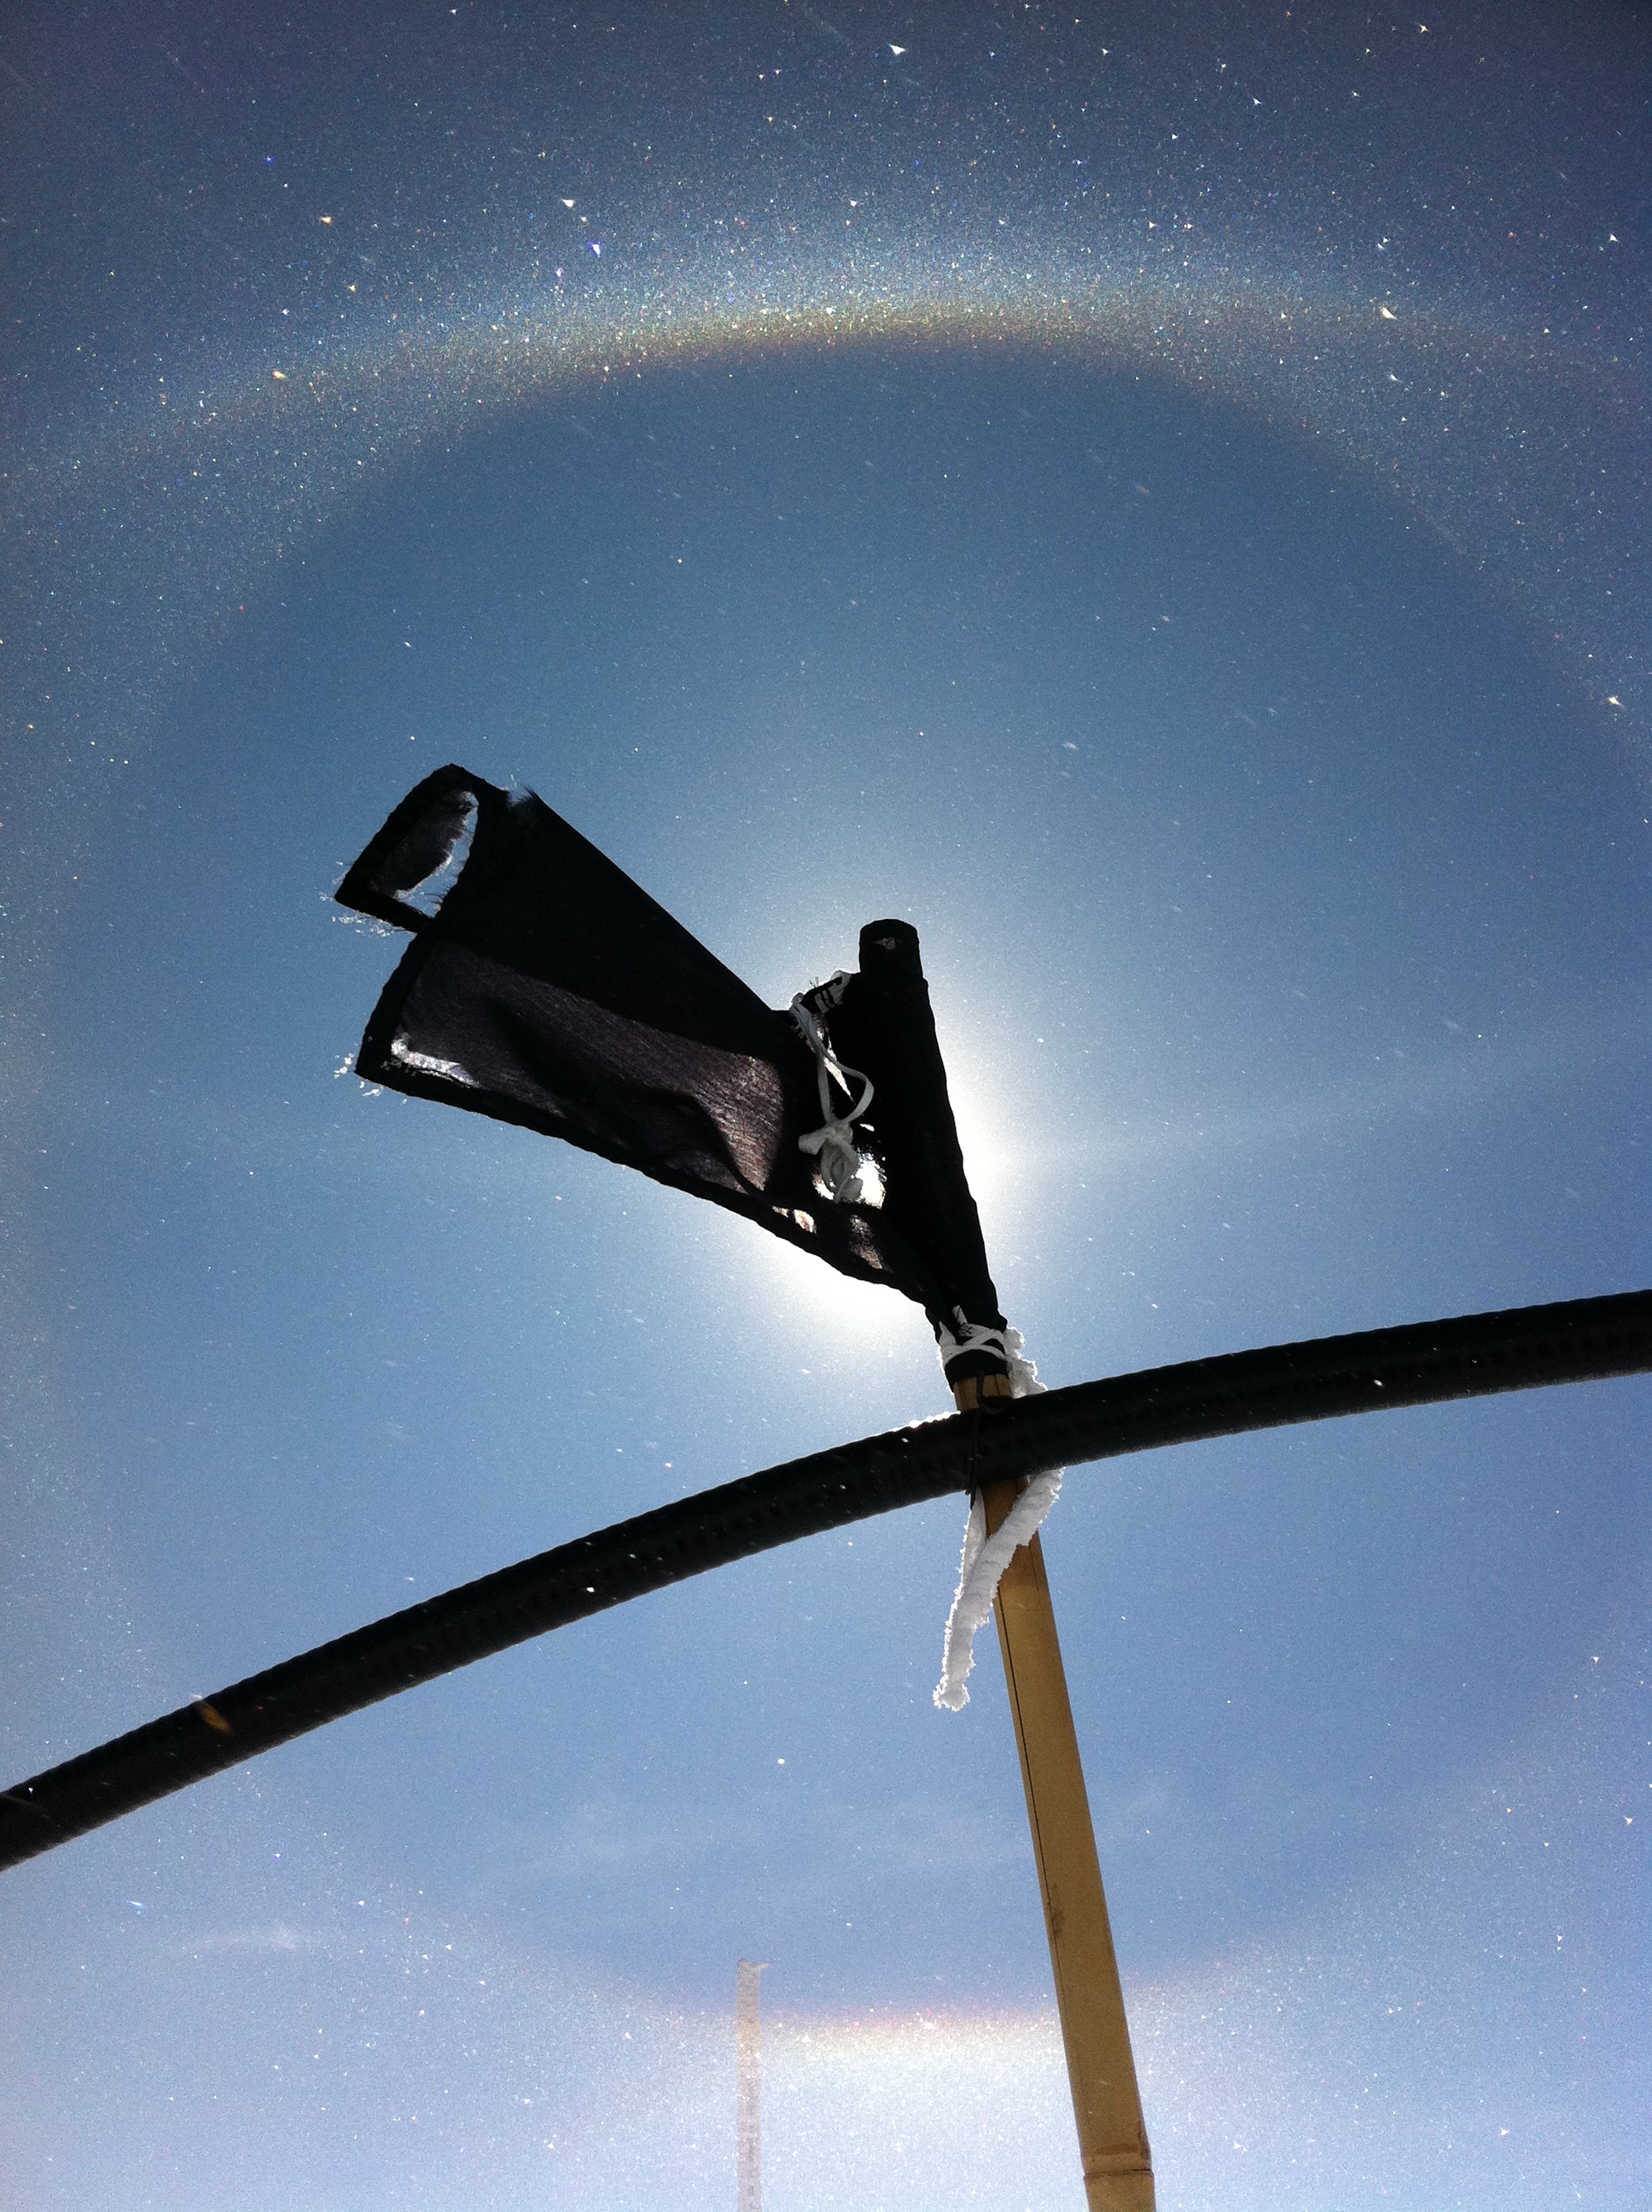
Ice crystals in the air lead to frequent optical phenomena over Greenland. PC: Matthew Shupe
Addressing all five of these research questions requires a team effort, with collaborators from the Universities of Colorado, Idaho, Oklahoma, Wisconsin, and Vanderbilt and Washington State Universities. Dr. Matthew Shupe, a research scientist with the Cooperative Institute for Research in Environmental Sciences at the University of Colorado and NOAA Earth System Research Laboratory, is one of the ICECAPS scientists.
Since its start in 2009, Shupe notes that the ICECAPS project has generated a lot of data. In fact, there are nearly 100 datasets (and counting) in the Arctic Data Center repository generated from the ICECAPS project. The data is collected by ground-based remote and in-situ instruments including cloud radar, depolarization lidar, microwave radiometer, infrared spectrometer, precipitation sensor, ice crystal imager, sodar, and radiosondes. Funded by the National Science Foundation’s Arctic Observing Network, with additional support from the U.S. Department of Energy Atmospheric Radiation Measurement Program and the National Oceanic and Atmospheric Administration, the real time data collected by these instruments results in multiple datasets each with multiple years of data. The Ceilometer Cloud Base Height Measurements dataset is just one example of the ICECAPS project’s data available for exploration in the Arctic Data Center’s data repository.
The quantity of ICECAPS data is impressive; but, more importantly, the ICECAPS data are also proving extremely valuable. “Radiosonde data are routinely assimilated into operational forecast models, and have been used by the airline industry to understand temperature structure over Greenland,” says Shupe. Data and observations from the ICECAPS project have also been used to develop new atmospheric instruments and evaluate the accuracy of satellite-based measurements.
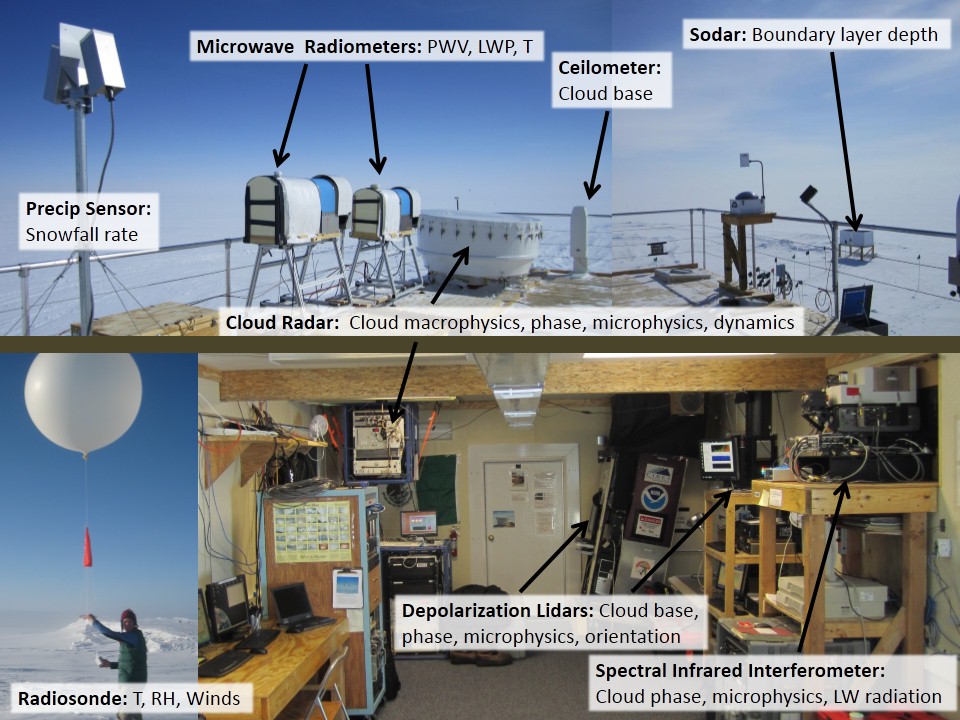
The instruments used by the ICECAPS project to collect data in Summit, Greenland. PC: Matthew Shupe
What are researchers learning from the data so far? One finding is the relationship between Arctic clouds and melting ice. “ICECAPS data have shown us that many properties of Arctic low-level mixed-phase clouds are inherent to the clouds themselves and less sensitive to the environment in which they occur,” says Shupe. “We have extended our knowledge of these clouds, finding that enhanced surface radiation from clouds plays a substantial role in determining the surface energy budget, surface temperature variability, and ultimately the amount of surface melt.”
“The data also revealed that precipitation over the central Greenland ice sheet is at a maximum in summer,” notes Shupe. And many important details about the annual evolution of atmospheric structure, ozone profiles above the ice sheet, and relationships between local atmospheric processes, have been described in over 30 publications during the past six years.
The ICECAPS data examines high-resolution atmospheric processes and is representative of central Greenland’s variable conditions, which makes the data a valuable resource for the modeling community. When incorporated into models, ICECAPS data can be used to better understand and predict future conditions in the Arctic, including in one of Shupe’s favorite places: the sea-ice edge. “In autumn, the combination of various forms of melted ice, melt ponds, open water, newly forming ice, and low sun angles makes the surface an interesting place,” says Shupe. “Both visually and scientifically.”
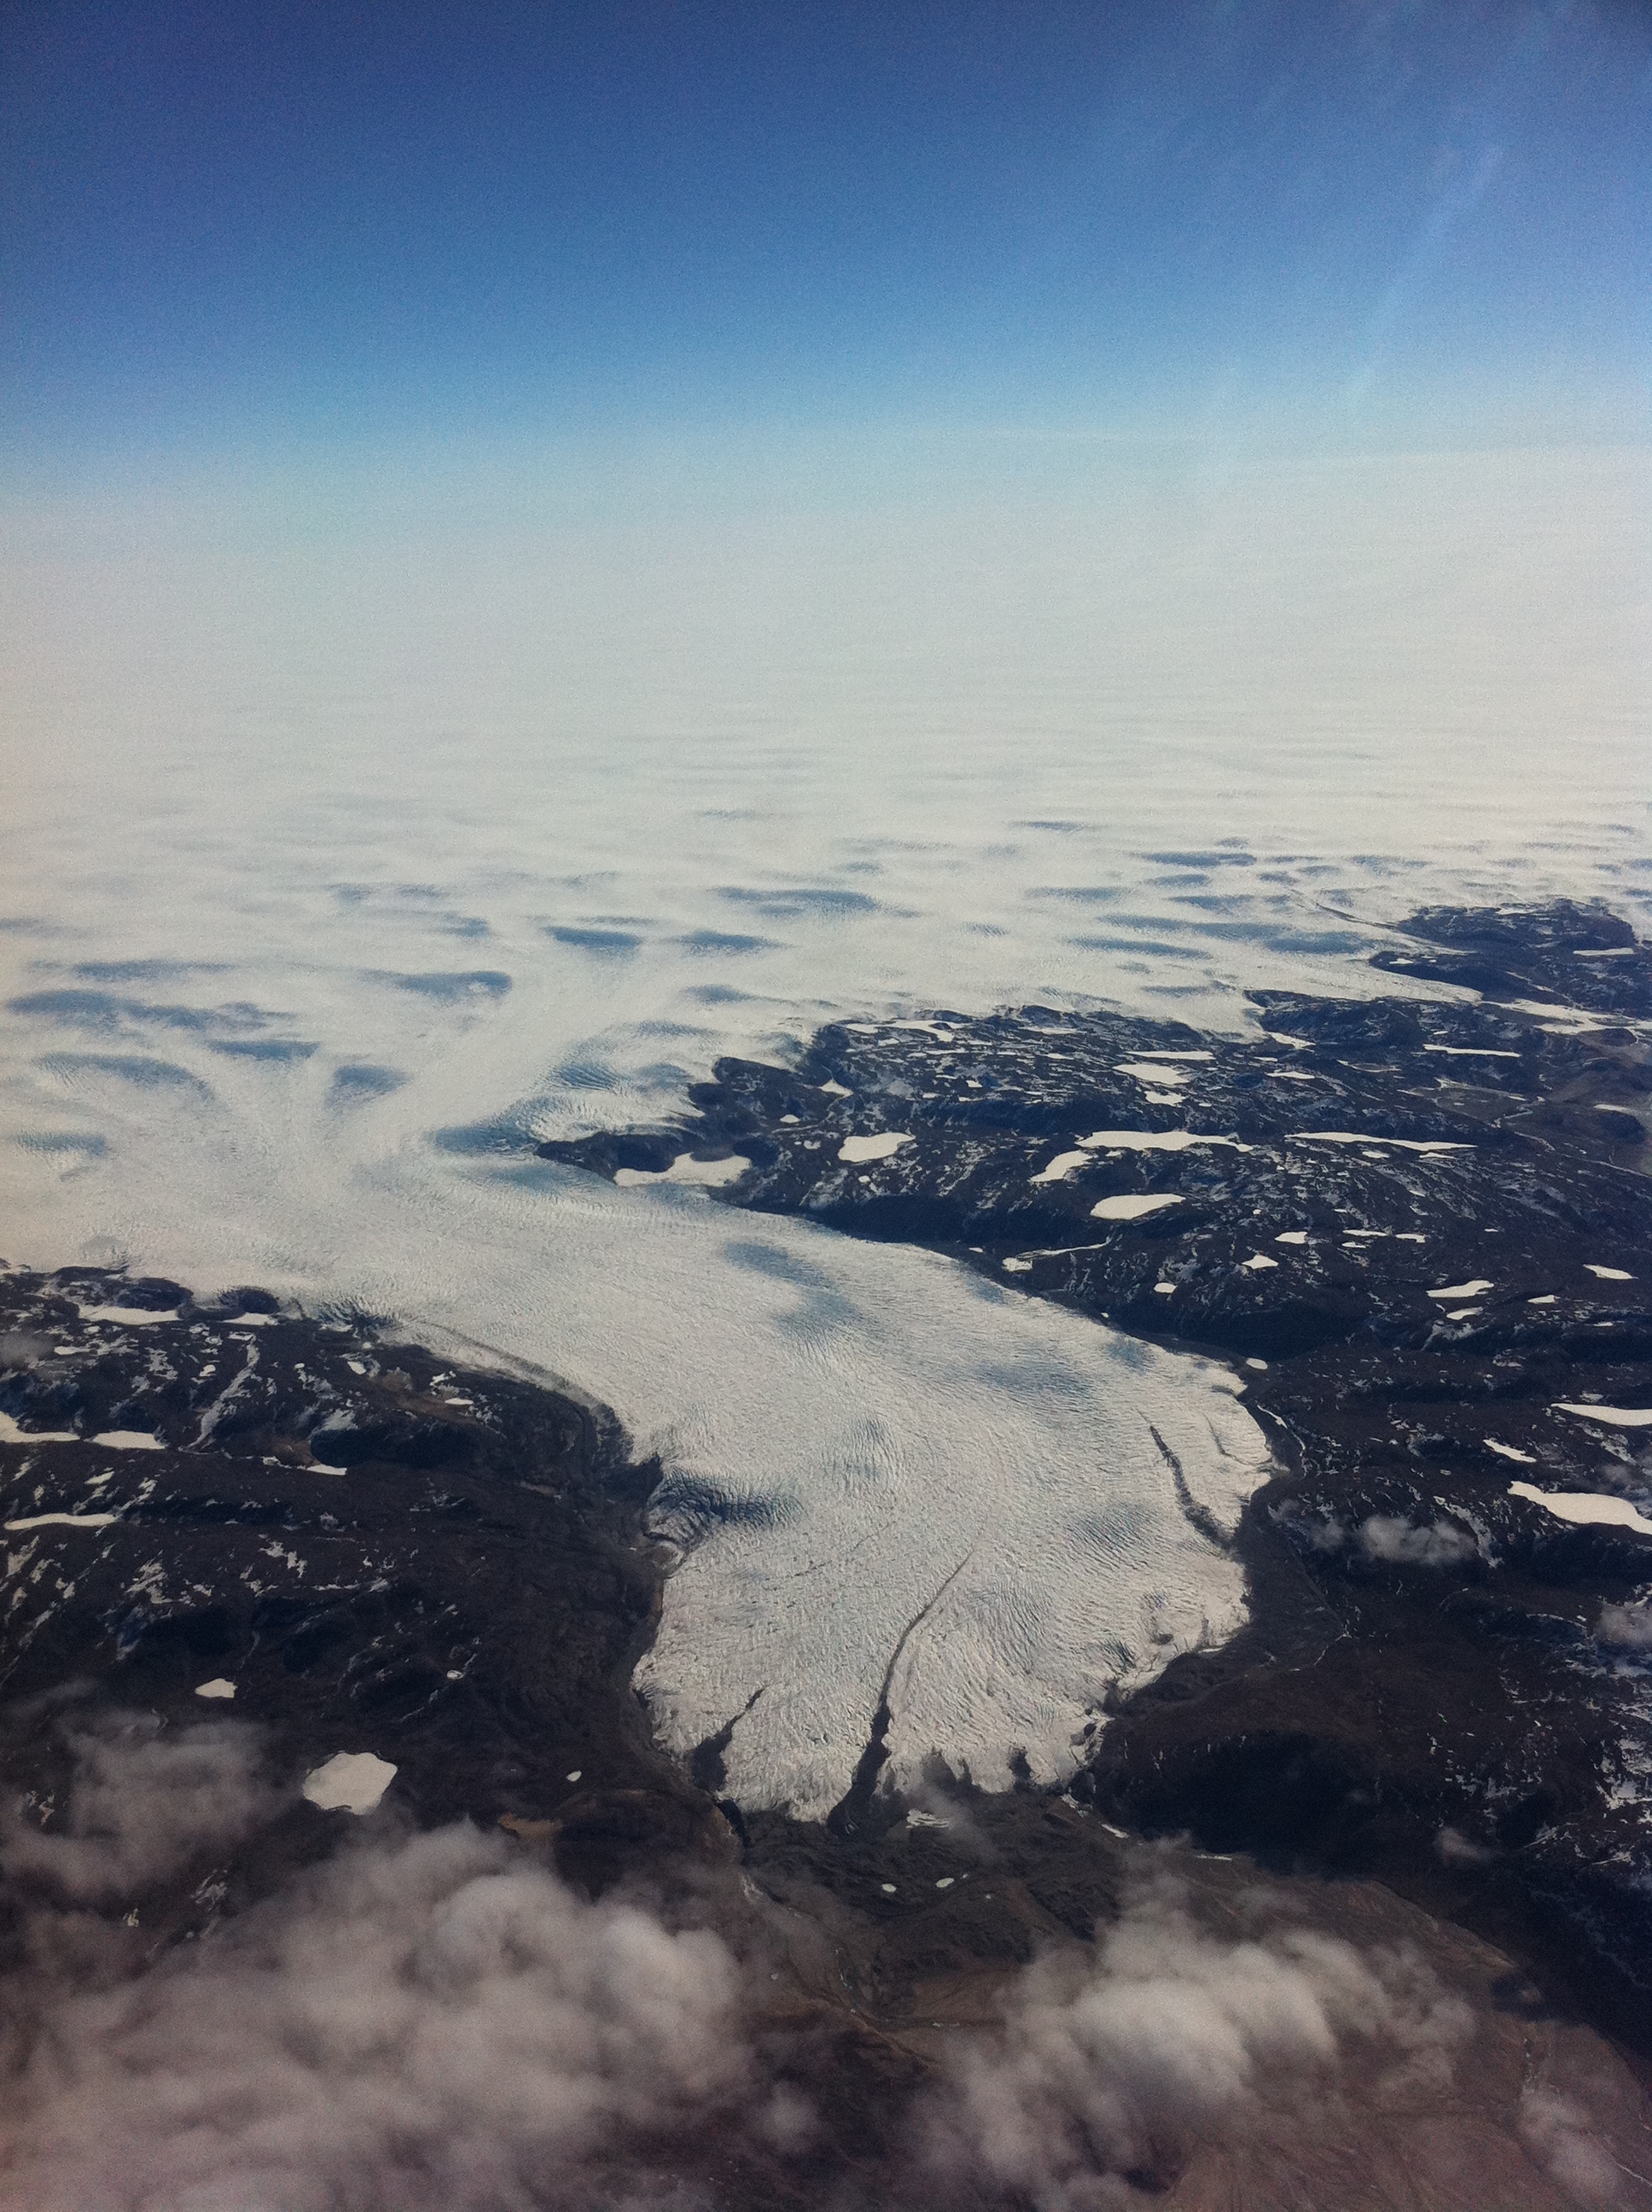
Glaciers extending off the edge of the Greenland Ice Sheet. PC: Matthew Shupe
To learn more about the project, check out the dataset and use the filter “ICECAPS” in the Arctic Data Center’s data repository search to discover more ICECAPS datasets to explore. You can also visit Shupe’s ICECAPS website for more information and links to ICECAPS publications.
Citation: Matthew Shupe. 2017. Ceilometer Cloud Base Height Measurements at Summit Station, Greenland, 2018. Arctic Data Center. doi:10.18739/A2KP7TQ9P
By Kathryn Meyer