Background and Information
![]() Since 2006, the Arctic Report Card (ARC) has been an annual report led by the National Oceanic and Atmospheric Administration (NOAA) that informs the general public about recent environmental changes across the Arctic, from the sea ice, weather patterns, snow cover, and more. Each report includes a series of essays that break down these changes in a way that is accessible to a wide audience.
Since 2006, the Arctic Report Card (ARC) has been an annual report led by the National Oceanic and Atmospheric Administration (NOAA) that informs the general public about recent environmental changes across the Arctic, from the sea ice, weather patterns, snow cover, and more. Each report includes a series of essays that break down these changes in a way that is accessible to a wide audience.
The Arctic Data Center has supported the Arctic Report Card with its dataset collection and making the data more accessible to the public. This partnership has supported making Arctic science more open and transparent.
Why the Arctic Report Card Matters
The Arctic is changing faster than the rest of the planet, making it increasingly important to track how these environmental shifts impact other global systems. Rapid changes across the region are transforming ecosystems, and while these impacts are most visible in the Arctic, their effects extend far beyond it.
The Arctic Report Card provides an important annual snapshot of these changes by bringing together observations from an interdisciplinary perspective. By synthesizing findings from a wide range of scientific disciplines, the report helps translate complex environmental data into accessible insights. Each analysis undergoes peer review, helping ensure the findings are supported by rigorous scientific findings. Over the past 20 years, the Arctic Report Card has helped keep track of environmental change and provide a clearer picture of how the Arctic is evolving.
A Collaborative Effort to Build the Arctic Report Card Data Portal
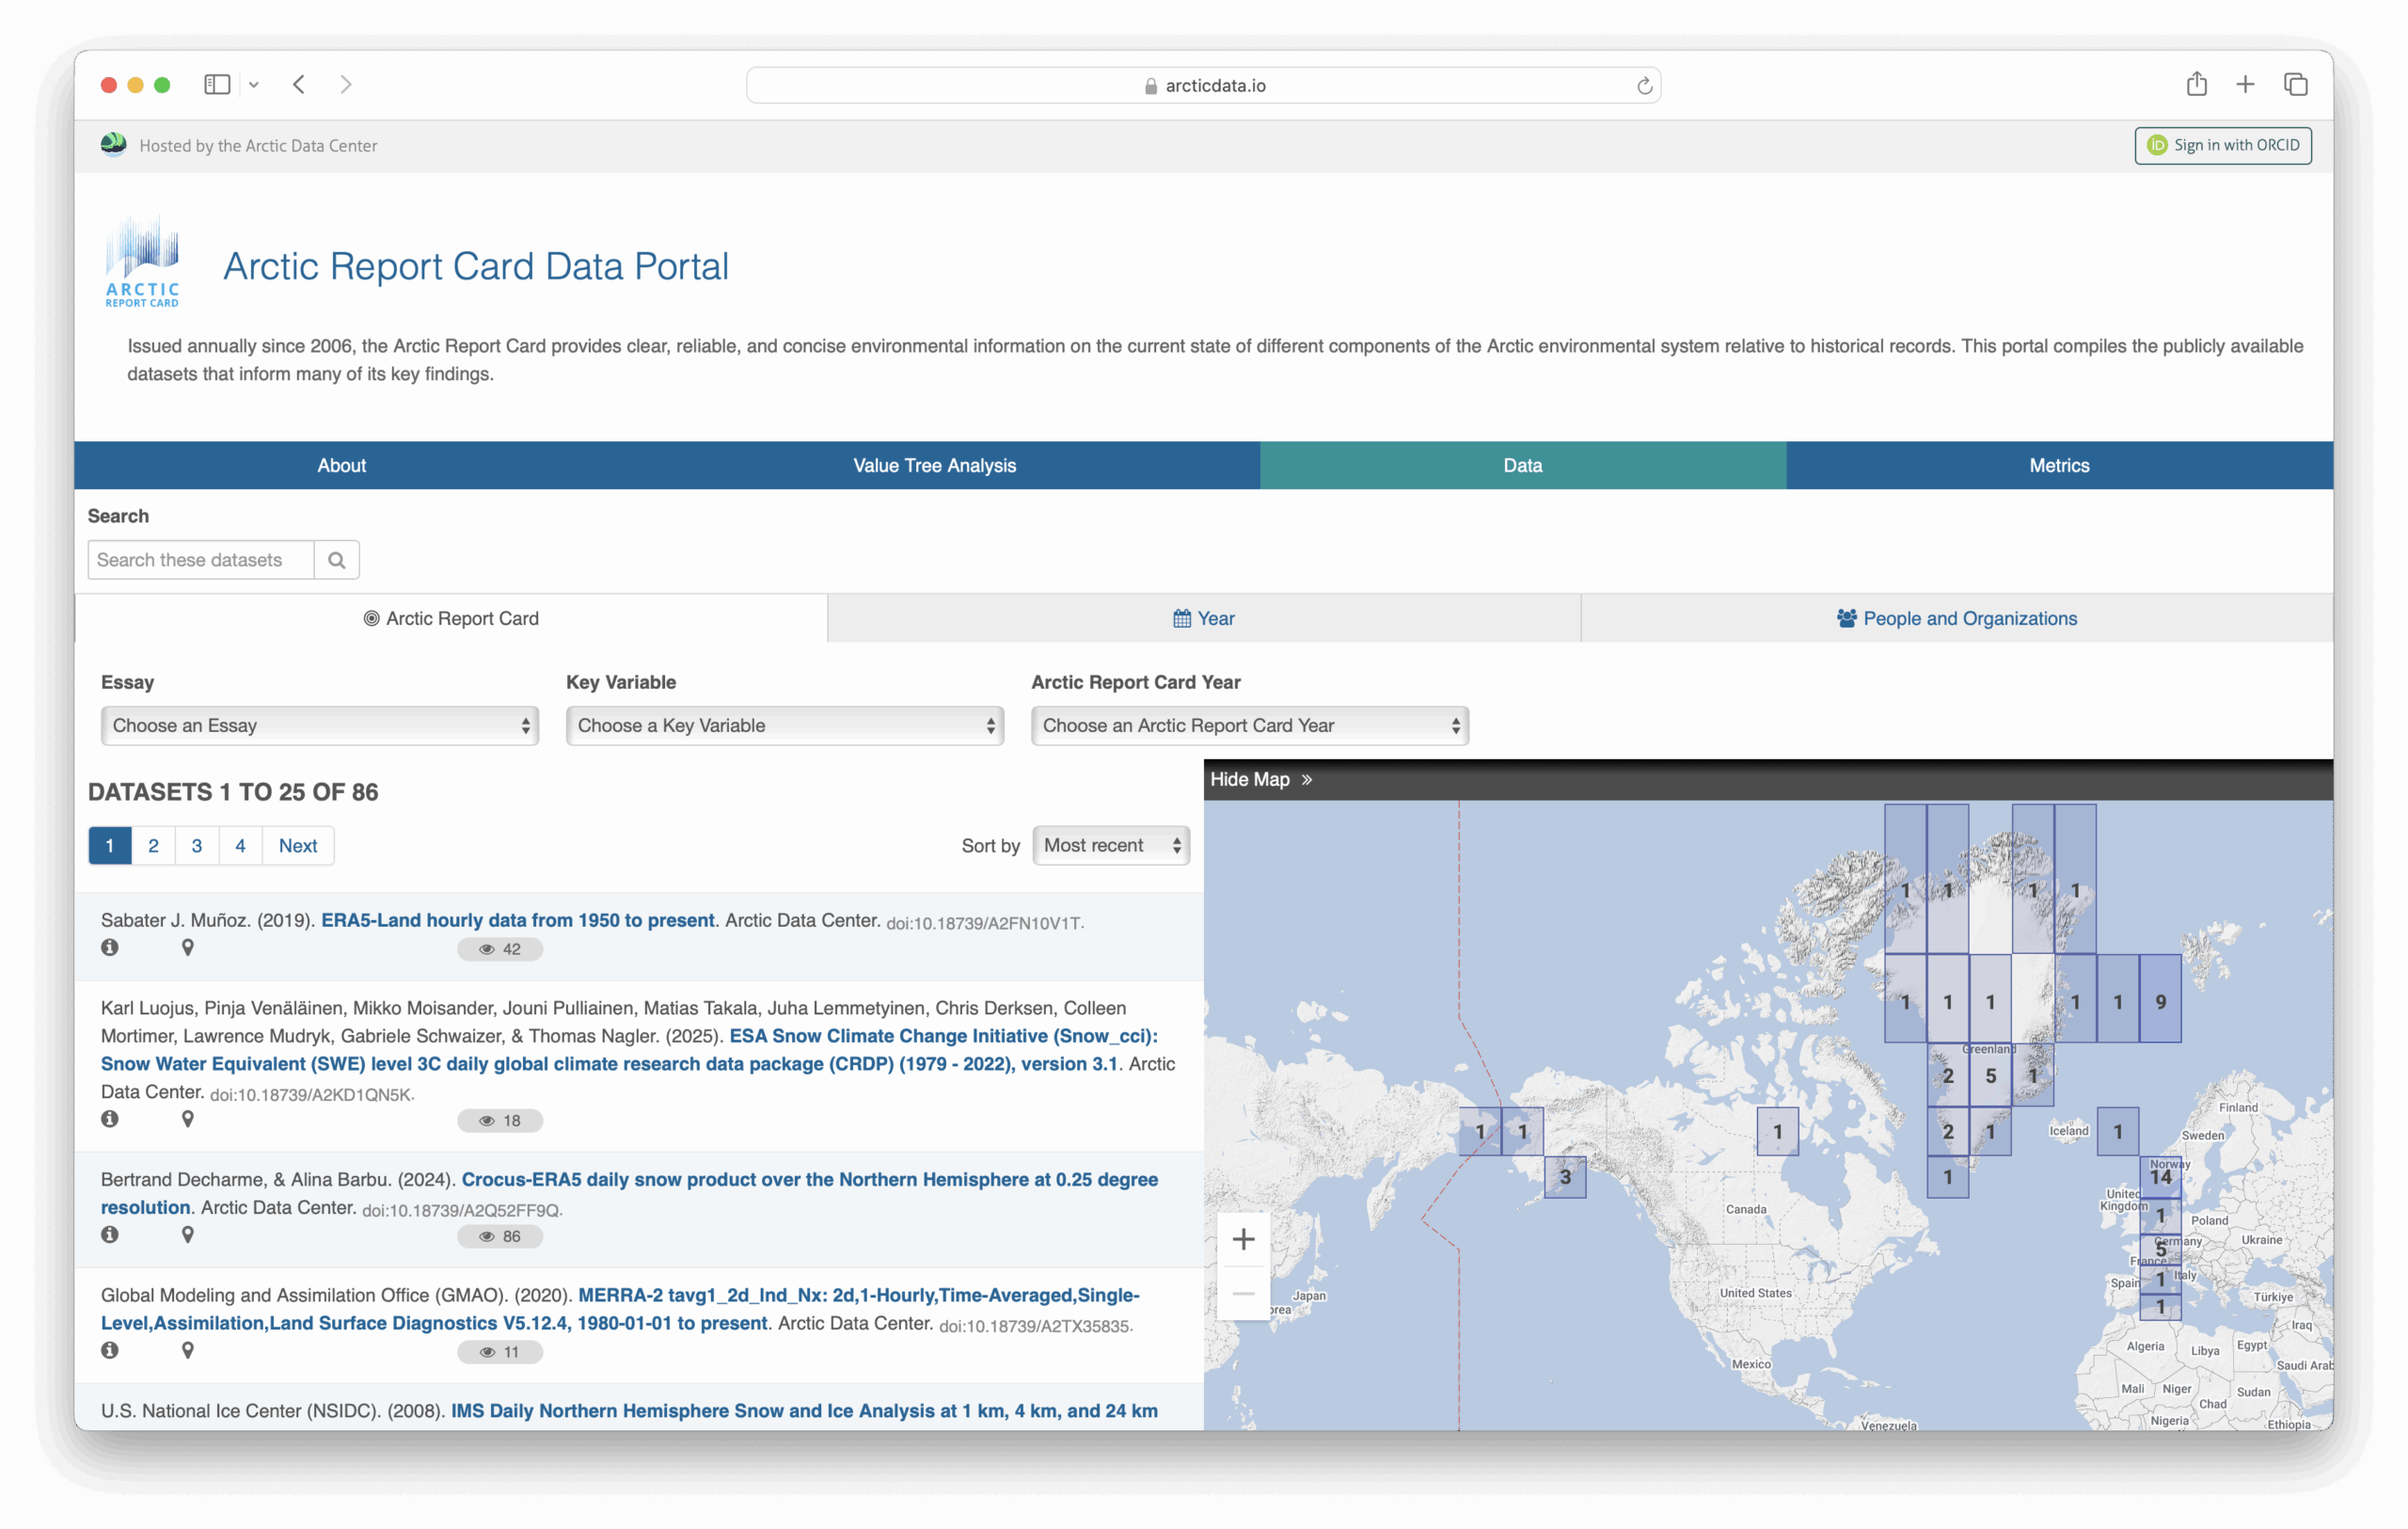
Screenshot of the Arctic Report Card Data Portal hosted by the Arctic Data Center.
Since 2020, the Arctic Data Center has partnered with the U.S. Arctic Observing Network (U.S. AON) and the Arctic Report Card team to share the datasets behind each report through a centralized Arctic Report Card Data Portal. This collaboration has ensured ARC datasets are more aligned with the FAIR Principles (Findable, Accessible, Interoperable, and Reusable) of data management, all while making them easier to access in one place.
The 86 datasets available in the data portal vary in subject, but they all connect to the report’s recurring eight essay topics (often referenced as “vital signs”). These include:
- Surface air temperature
- Terrestrial snow cover
- The Greenland Ice Sheet
- Sea ice
- Sea surface temperature
- Arctic Ocean primary productivity
- Tundra greenness
- Precipitation
There are also “Other Indicators”, which are topics updated every 2-4 years, and “Frostbites”, which are current and newsworthy topics relevant to the year.
Within the portal’s data tab, users can easily search datasets by essay topic and key variables from the past six Arctic Report Cards. These topics and key variables are organized into an ontology to help annotate and organize these datasets.
The Arctic Data Center’s data curators work alongside the Arctic Report Card authors to ensure the datasets referenced and cited in each of the essays are preserved and accessible through the data portal. This ongoing communication and coordination also allows researchers to share their work with a wider audience while helping the Arctic Data Center support and advance Arctic science.
Many datasets are published in other repositories, in which case the Arctic Data Center creates a metadata record detailing the dataset and re-directs viewers to the original repository for access.
With new data portal features available such as interactive Shiny apps and geospatial data map visualizations, the Arctic Data Center hopes to expand on the way visitors can explore the data that inform the essays.
In addition to the Arctic Report Card Data Portal, NOAA has also built an Arctic Report Card Data Dashboard which displays the data in a different visual medium. This dashboard covers almost all of the essay topics and allows users to interact with the chart which contains the data and learn more about its key takeaways. To learn more, explore the data dashboard on NOAA’s In the Arctic site.
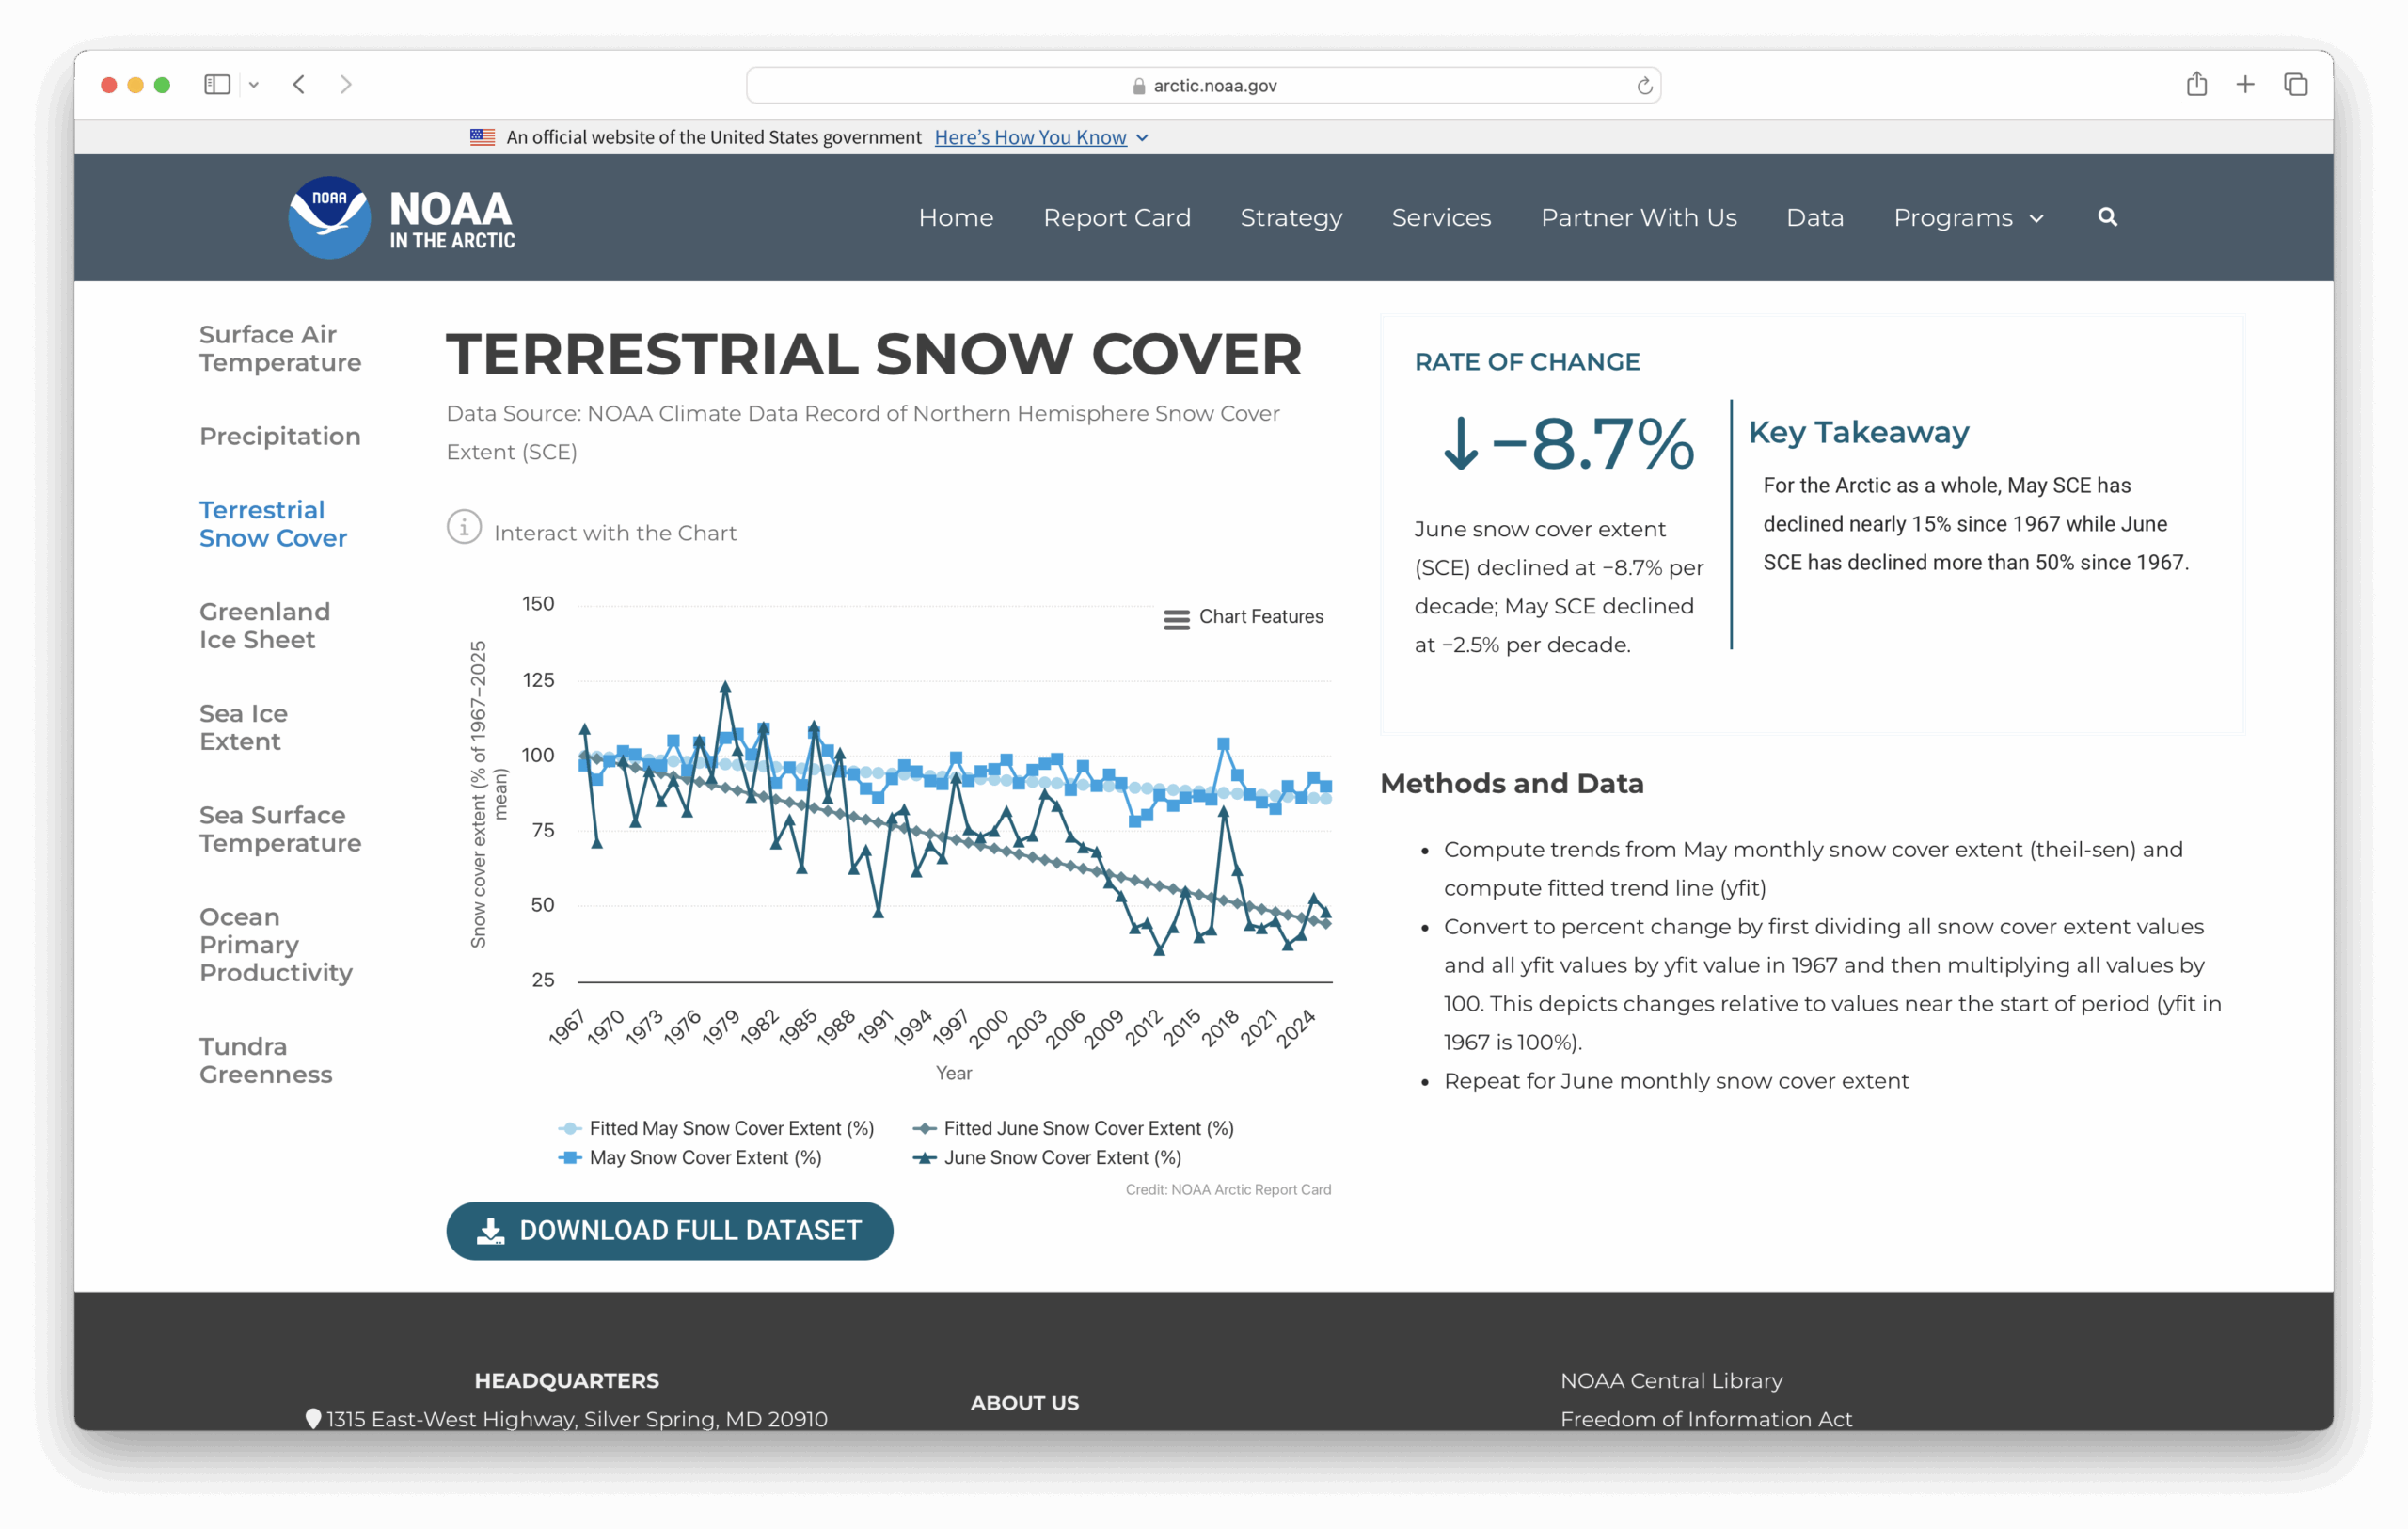
Screenshot of the Arctic Report Card Data Dashboard from NOAA’s In the Arctic site.
2025 Arctic Report Card
The latest report marks 20 years of the Arctic Report Card documenting environmental changes across the region. Results from 2025 show that the Arctic is warming faster than the rest of the planet, causing ripple effects in the atmosphere, ocean, and on the land, which are highlighted in the headlines below.
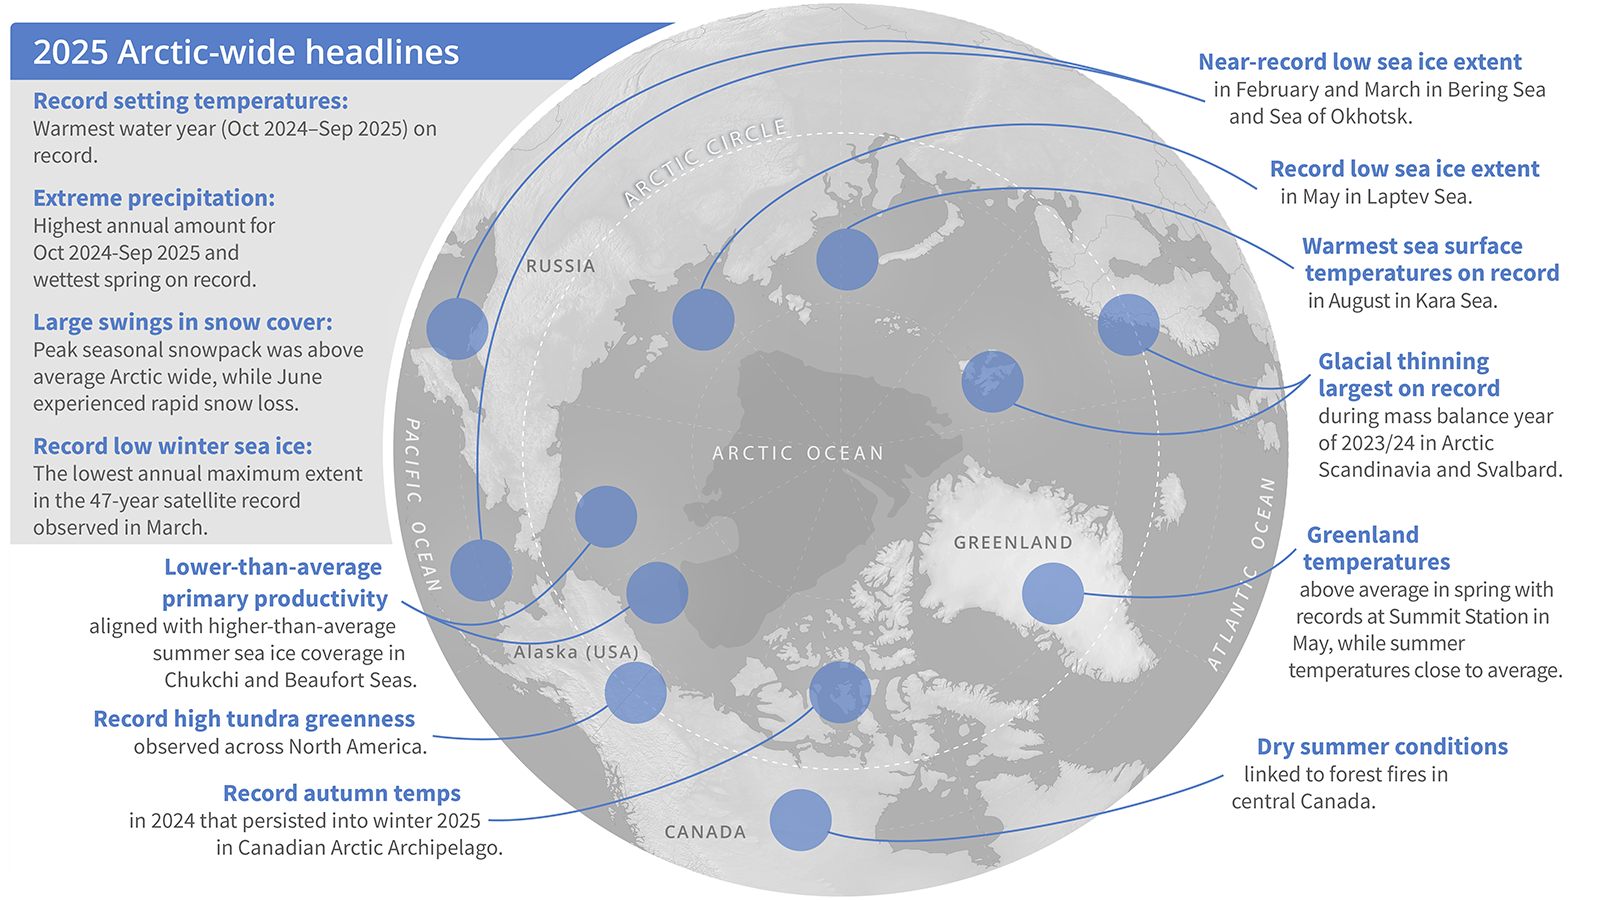
Arctic-wide highlights from the 2025 Arctic Report Card, showcasing major environmental changes observed across the region over the past year.
Not only is the report a collaboration between scientists, but it also incorporates Indigenous knowledge and partnerships to create a more well-rounded and robust understanding of the environmental changes being observed.
For more information, explore the 2025 Headlines and Overview from the Arctic Report Card, or watch their YouTube video summarizing the report’s most recent findings. They also have an Arctic Report Card YouTube Playlist which features various animations and videos following the results of the 2010 report and onward.
Supporting Open Science
As environmental changes continue to reshape the Arctic, accessible and well-documented data will play a critical role in understanding these transformations. The collaboration between the Arctic Report Card team, the US Arctic Observing Network, and the Arctic Data Center help ensure the data behind each observation remains accessible to the broader scientific community.
By preserving and sharing the datasets through the Arctic Report Card Data Portal, this partnership supports transparency, reproducibility, and collaboration in Arctic research. It also allows for researchers, educators, decision-makers, and other communities alike to better understand what these rapid changes mean for the Arctic and the rest of the world.
Written by Angie Garcia, Community Engagement and Outreach Coordinator, and Justin Kadi, Projects Data Coordinator