List of Synthesis Working Group Members & Data Contributors
Frequently Asked Questions (FAQs)
Problem statement
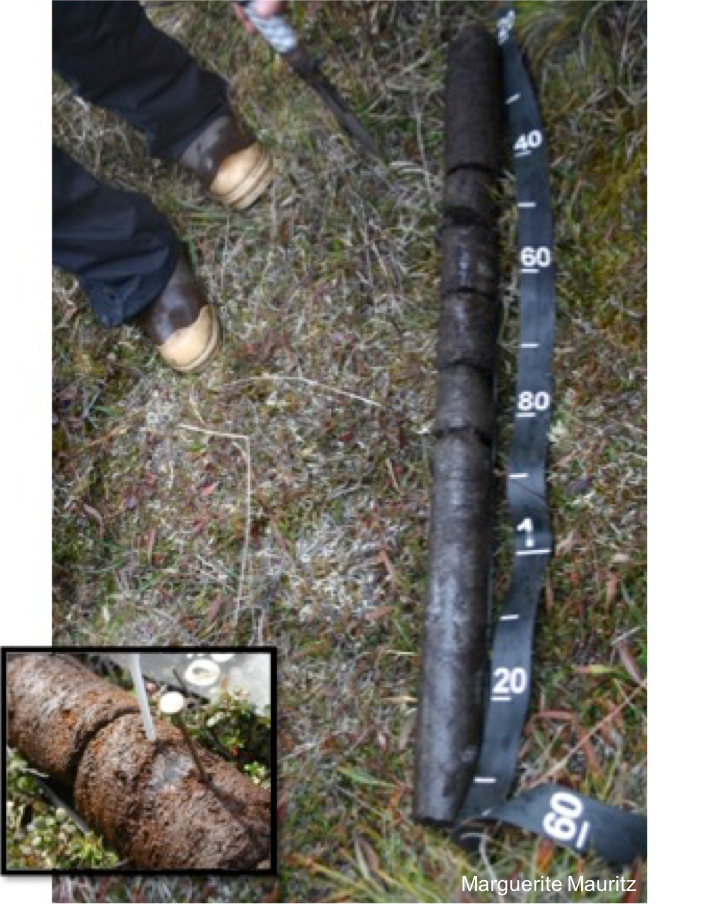
Permafrost Carbon Soil Core Sample
Permafrost carbon (C) remains one of the most important, but least addressed, challenges for climate change detection in high latitudes. Permafrost C, the remnants of plants, microbes, and animals accumulated in perennially frozen Arctic soil over thousands of years, currently holds twice as much C as the atmosphere and may be a climate tipping point1-4. Release of just a fraction of this frozen C as greenhouse gases, carbon dioxide (CO2) and methane (CH4), into the atmosphere would dramatically increase the rate of future global climate warming5,6.
Regional and global observation networks are showing rapid and unprecedented change in Earth’s cryosphere such as retreating glaciers7, melting ice sheets8, declining sea ice9, and warming permafrost10. Despite forecasts of significant C cycle changes in the permafrost zone, there is no equivalent network able to document regional changes in permafrost C. Part of the reason is that permafrost C is not readily detectable at the circumpolar scale with remote sensing technologies. Instead, measurements of permafrost C dynamics occur at individual locations around the Arctic, and efforts to integrate information across sites occur only sporadically rather than systematically. This leaves the science community unable to rapidly report on changes in the permafrost C pool. Systematic synthesis across sites is required to provide the up-to-date, pan-Arctic view needed by society11. This workshop will build upon past syntheses to provide a current estimate of high-latitude permafrost zone CO2 fluxes and lay out a framework for regular future updates.
Goals
Over the course of two workshops we will bring together an international team of Arctic scientists to reconcile three inter-related data synthesis activities and provide a framework for annual reporting of Arctic ecosystem C balance. We will ask 1) How does the magnitude of permafrost zone C fluxes change over time (seasonally, inter-annually)? and, 2) What are the temporal drivers of variation in C fluxes? Net ecosystem C exchange (NEE) has been measured in northern ecosystems over the past decades with various closed chamber techniques and more recently with the eddy covariance technique. Eddy tower data is considered the current gold-standard due to high temporal coverage but will always be limited to fewer sites because it is cost intensive. In contrast, chamber measurements can be used for whole-ecosystem C exchange in many more tundra vegetation types but are temporally more limited. Given the general scarcity of Arctic measurements, the most comprehensive picture of decadal Arctic C exchange will need to leverage both of these measurement techniques. The focus for this proposal will be on CO2 exchange. While CH4 is also an important greenhouse gas, it is being addressed in separate synthesis efforts.
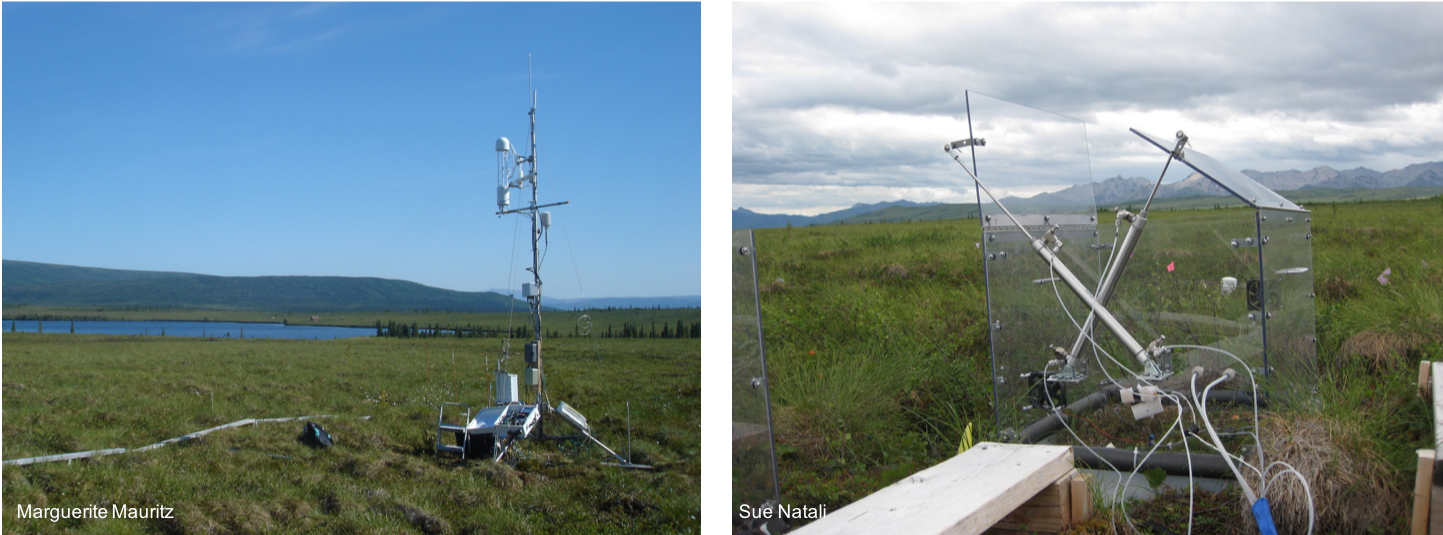
Eddy Tower (Left) & Automated Net Ecosystem Exchange Chamber (Right) at Eight Mile Lake, Healy, Alaska
We will:
- Reconcile two past C flux syntheses 12, 13 and bring to completion a non-summer (winter, spring, fall) season flux synthesis14 to create a new, comprehensive database that incorporates multiple C flux measurement techniques (chambers, eddy towers).
- Merge contemporary data with the historic syntheses so that C dynamics for the permafrost zone can be reported as close to the present time as data processing allows.
- Provide a framework (protocols+code) for seasonal and annual gap-filling across multiple C flux measurement techniques to facilitate the addition of new permafrost zone C flux data as they become available. This framework will allow the dataset to be updated on an annual basis, and thus be incorporated into important communication outlets like NOAA’s Arctic Report Card.
If you collect Arctic flux data and/or are interested in synthesis activities, please contact Ted Schuur and Marguerite Mauritz.
Role of the Arctic Data Center
The Arctic Data Center contains a number of key chamber- and tower-based C datasets that will be included in this effort, and in particular will be a natural home for the newly-merged historic dataset. The contemporary data synthesis will rely on data in the Arctic Data Center, and will draw upon other databases that house C flux data. No repository exists for the multiple C flux techniques that we propose to synthesize here, nor does any database have the Arctic focus of the Arctic Data Center. The end products of this synthesis will position the Arctic Data Center as the go-to repository for the up-to-date view of permafrost zone C fluxes.
Working Group Members
| Name | Institution |
|---|---|
| Ted Schuur (ted.schuur@nau.edu) | Northern Arizona University, Flagstaff |
| Marguerite Mauritz (marguerite.mauritz@nau.edu) | Northern Arizona University, Flagstaff |
| Eugenie Euskirchen | University of Alaska, Fairbanks |
| Sue Natali | Woods Hole Research Center |
| Gerardo Celis | Northern Arizona University, Flagstaff |
| Jennifer Watts | Woods Hole Research Center |
| Roisin Commane | Harvard University |
| Mathias Goeckede | Max Planck Institute |
| Elyn Humphries | Carleton University |
| Min Kwon | Korean Polar Research Institute |
| Derek Lemoine | University of Arizona |
| Miska Luoto | University of Helsinki |
| Steve Oberbauer | Florida International University |
| Nick Parazoo | NASA Jet Propulsion Laboratory |
| Frans-Jan Parmentier | Arctic University of Norway |
| Brendan Rogers | Woods Hole Research Center |
| Oliver Sonnentag | University of Montreal |
| Margaret Torn | Lawrence Berkeley National Laboratory |
| Masahito Ueyama | Osaka Prefecture University |
| Anna Virkkala | University of Helsinki |
| Donatella Zona | University of Sheffield, San Diego State University |

Attending members of the Permafrost Carbon Synthesis Working Group, at NCEAS March 2018 (Left) and October 2018 (Right). PC: Ginger Gillquist
Data Contributors or Data Extraction Sources (as of 9th October, 2018)
| Name |
|---|
| E.F. Belshe* |
| G. Celis* |
| C. Emmerton |
| M. Goeckede |
| Y. Harazono |
| E. Humphreys |
| M. Hurkuck |
| Y. Kobayashi |
| J. Kochendorfer |
| A. Kotani |
| P.M. Lafleur |
| T. Machimura |
| M.E. Marushchak |
| Y. Matsuura |
| M. Mauritz* |
| S.M.N. Natali* |
| A.D. McGuire* |
| M. Ueyama |
| A. Varlagin |
| A. Virkkala* |
| C. Voigt |
| FluxNet 2015 |
*Contributions from these individuals may have multiple contributors because they extracted data from literature or FluxNet 2015.
Details about Past Synthesis
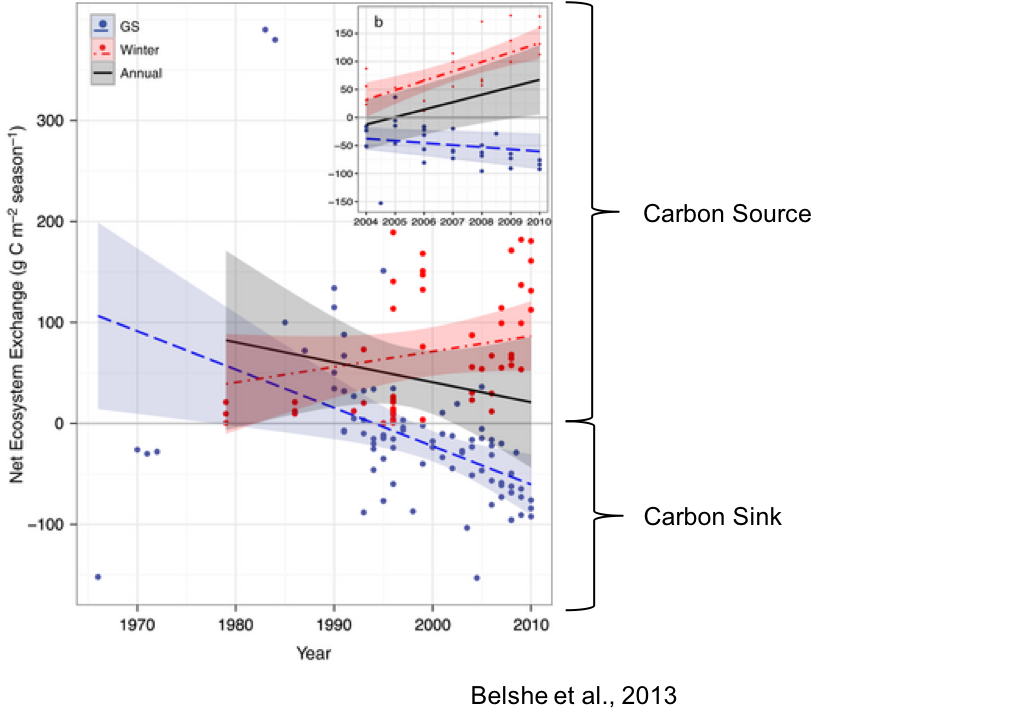
Figure 1 Estimates of temporal trends of of CO2 net ecosystem exchange12
Past synthesis shows that northern ecosystems typically gain C (C sink) stored in plant biomass and soil organic matter during the short summer growing season (GS) when plant productivity is greater than C respired back to the atmosphere by soil organisms. Measurements of tundra ecosystem C exchange over the past several decades show that C gain during the growing season (Figure 1) has been increasing over time (blue line) across sites (individual blue points)12. Plant growth can be stimulated by warmer conditions, increased atmospheric CO2, and increased soil nutrients14-18.
Net C uptake during the growing season (June-August) is offset, in part, by net C release during the winter/non-summer (Oct-April, which includes fall and spring shoulder seasons), when C loss via respiration is greater than plant C gain. Observations of winter C exchange are more limited than those made during the summer, but C release in the winter appears to be increasing over the past several decades (red line).
Summing together growing season and winter shows that tundra had a net release of C to the atmosphere (C source) on an annual basis (black line) during the 1990s into the early 2000s. Increased summer uptake may have shifted tundra towards C neutrality by mid-2000s, but this trend is sensitive to the limited availability of winter data. An analysis of only the most recent time period (2004-2010) where winter flux measurements were more available (Figure 1 inset), shows rapidly increasing winter C loss could have made tundra ecosystems greater annual C sources to the atmosphere in the mid-late 2000s12. The fact that the annual trend reverses when considering only the shorter, but more robust, winter dataset from 2004-2010 highlights the critical need for expanded winter/non-summer C flux observations.
The work described above provides a solid foundation of historic data trends, but there has been no comprehensive report on the state of ecosystem C fluxes since 2010, even though the availability of winter data has increased substantially. Furthermore, the analysis described above has not been reconciled with the findings of a related synthesis that reported the Arctic as a consistent C sink over the same time period13. Simply put, the Arctic research community is not yet in the position to provide a unified and up-to-date view of either historic or contemporary changes in permafrost C.
Citations
1 Zimov, S. A. et al. Permafrost carbon: Stock and decomposability of a globally significant carbon pool. Geophysical Research Letters 33, doi: 10.1029/2006GL027484 (2006).
2 Hugelius, G. et al. Improved estimates show large circumpolar stocks of permafrost carbon while quantifying substantial uncertainty ranges and identifying remaining data gaps. 11, 4771–4822, doi: 10.5194/bgd-11-4771-2014 (2014).
3 Tarnocai, C., Canadell, J. G., Mazhitova, G., Schuur, E. A. G. & Kuhry, P. Soil organic carbon pools in the northern circumpolar permafrost region. Global Biogeochemical Cycles 23, doi: 10.1029/2008GB003327 (2009).
4 Schuur, E. A. G. et al. Vulnerability of permafrost carbon to climate change: Implications for the global carbon cycle. Bioscience 58, 701-714, doi.org/10.1641/B580807 (2008).
5 Schuur, E. A. G. et al. Climate change and the permafrost carbon feedback. Nature 520, 171-179, doi:10.1038/nature14338 (2015).
6 Koven, C. et al. Permafrost carbon-climate feedbacks accelerate global warming. PNAS 108, 14769-14774, doi: 10.1073/pnas.1103910108 (2011).
7 Zemp, M. et al. Historically unprecedented global glacier decline in the early 21st century. Journal of Glaciology 61, 745-762, doi:10.3189/2015JoG15J017 (2015).
8 Vaughan, D. G. et al. Observations: Cryosphere. In: Climate Change 2013: The Physical Science Basis. Contribution of Working Group I to the Fifth Assessment Report of the Intergovernmental Panel on Climate Change (Cambridge, United Kingdom and New York, NY, USA, 2013).
9 Perovich, D. et al. Sea Ice [in Arctic Report Card 2016]. (NOAA, http://www.arctic.noaa.gov/Report-Card/Report-Card-2016/ArtMID/5022/ArticleID/286/Sea-Ice, 2016).
10 Romanovsky, V. E. et al. [The Arctic] Terrestrial Permafrost. In: State of the Climate in 2015. S149-S152 (2015).
11 Overland, J. E., Wang, M., Walsh, J. E. & Stroeve, J. C. Future Arctic climate changes: Adaptation and mitigation time scales. Earth’s Future 2, 68-74, doi:10.1002/2013EF000162 (2014).
12 Belshe, E. F., Schuur, E. A. G. & Bolker, B. M. Tundra ecosystems observed to be CO2 sources due to differential amplification of the carbon cycle. Ecology Letters 16, 1307-1315, doi: 10.1111/ele.12164 (2013).
13 McGuire, A. et al. An assessment of the carbon balance of Arctic tundra: comparisons among observations, process models, and atmospheric inversions. Biogeosciences 9, 3185-3204, doi:10.5194/bg-9-3185-2012 (2012).
14 Natali, S. M. et al. in 2017 Joint North American Carbon Program and Ameriflux PI Meeting (North Bethesda, MD, USA, 2017).
15 Walker, M. D. et al. Plant community responses to experimental warming across the tundra biome. Proceedings of the National Academy of Sciences 103, 1342-1346, doi.org/10.1073/pnas.0503198103 (2006).
16 Salmon, V. G. et al. Nitrogen availability increases in a tundra ecosystem during five years of experimental permafrost thaw. Global Change Biology 22, 1927-1941, doi:10.1111/gcb.13204 (2016).
17 Epstein, H. et al. Dynamics of aboveground phytomass of the circumpolar Arctic tundra during the past three decades. Environmental Research Letters 7(1), doi: 10.1088/1748-9326/7/1/015506 (2012).
18 Elmendorf, S. C. et al. Plot-scale evidence of tundra vegetation change and links to recent summer warming. Nature Clim. Change 2, 453-457, doi:10.1038/nclimate1465 (2012).