Create a custom, branded website (data portal) for your research topic or lab group that spans datasets in the Arctic Data Center – available for all users. Portals provide a convenient, customizable way to communicate and share your science, your team, and related data from within the Arctic Data Center.
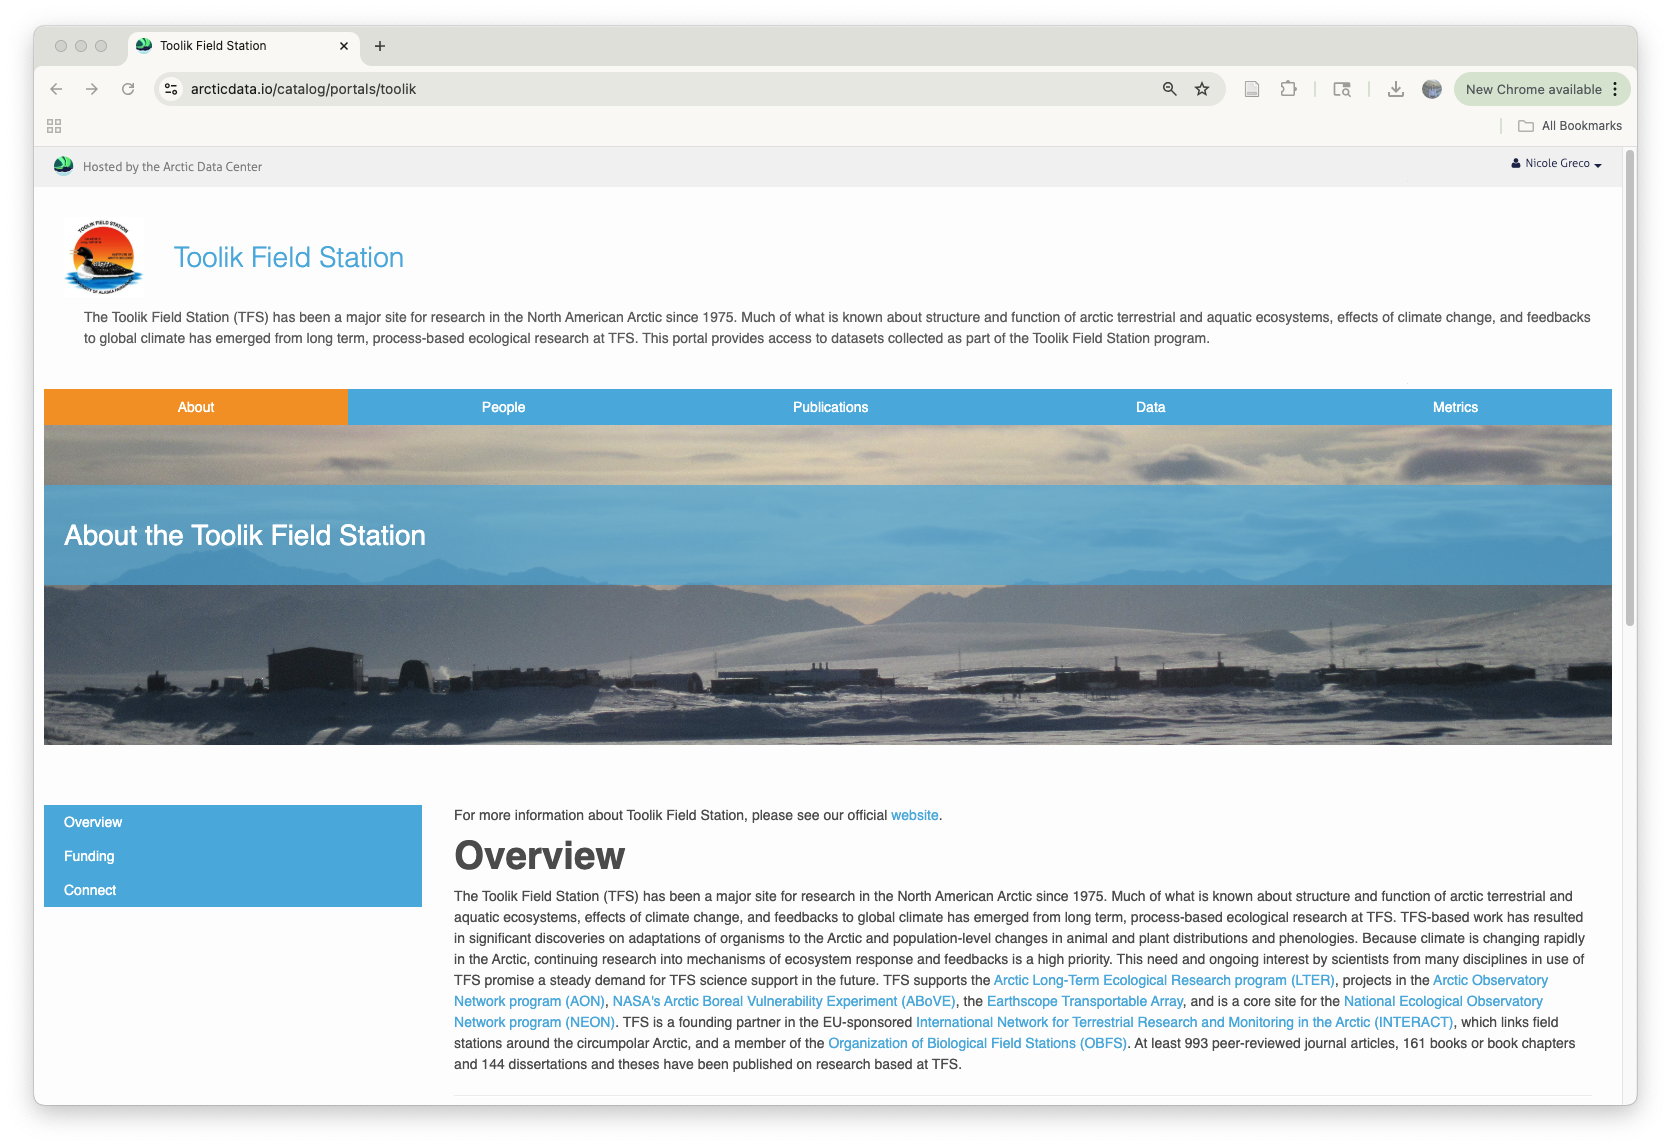
Portals can be created for a specific project, such as the Permafrost Discovery Gateway, for a specific organization, like the Toolik Field Station, or as a way to organize project outcomes without the data, like this portal for the Proceedings of the Permafrost & Infrastructure Symposium.
Showcase Your Research with a Custom Portal
Bundle related datasets all in one place
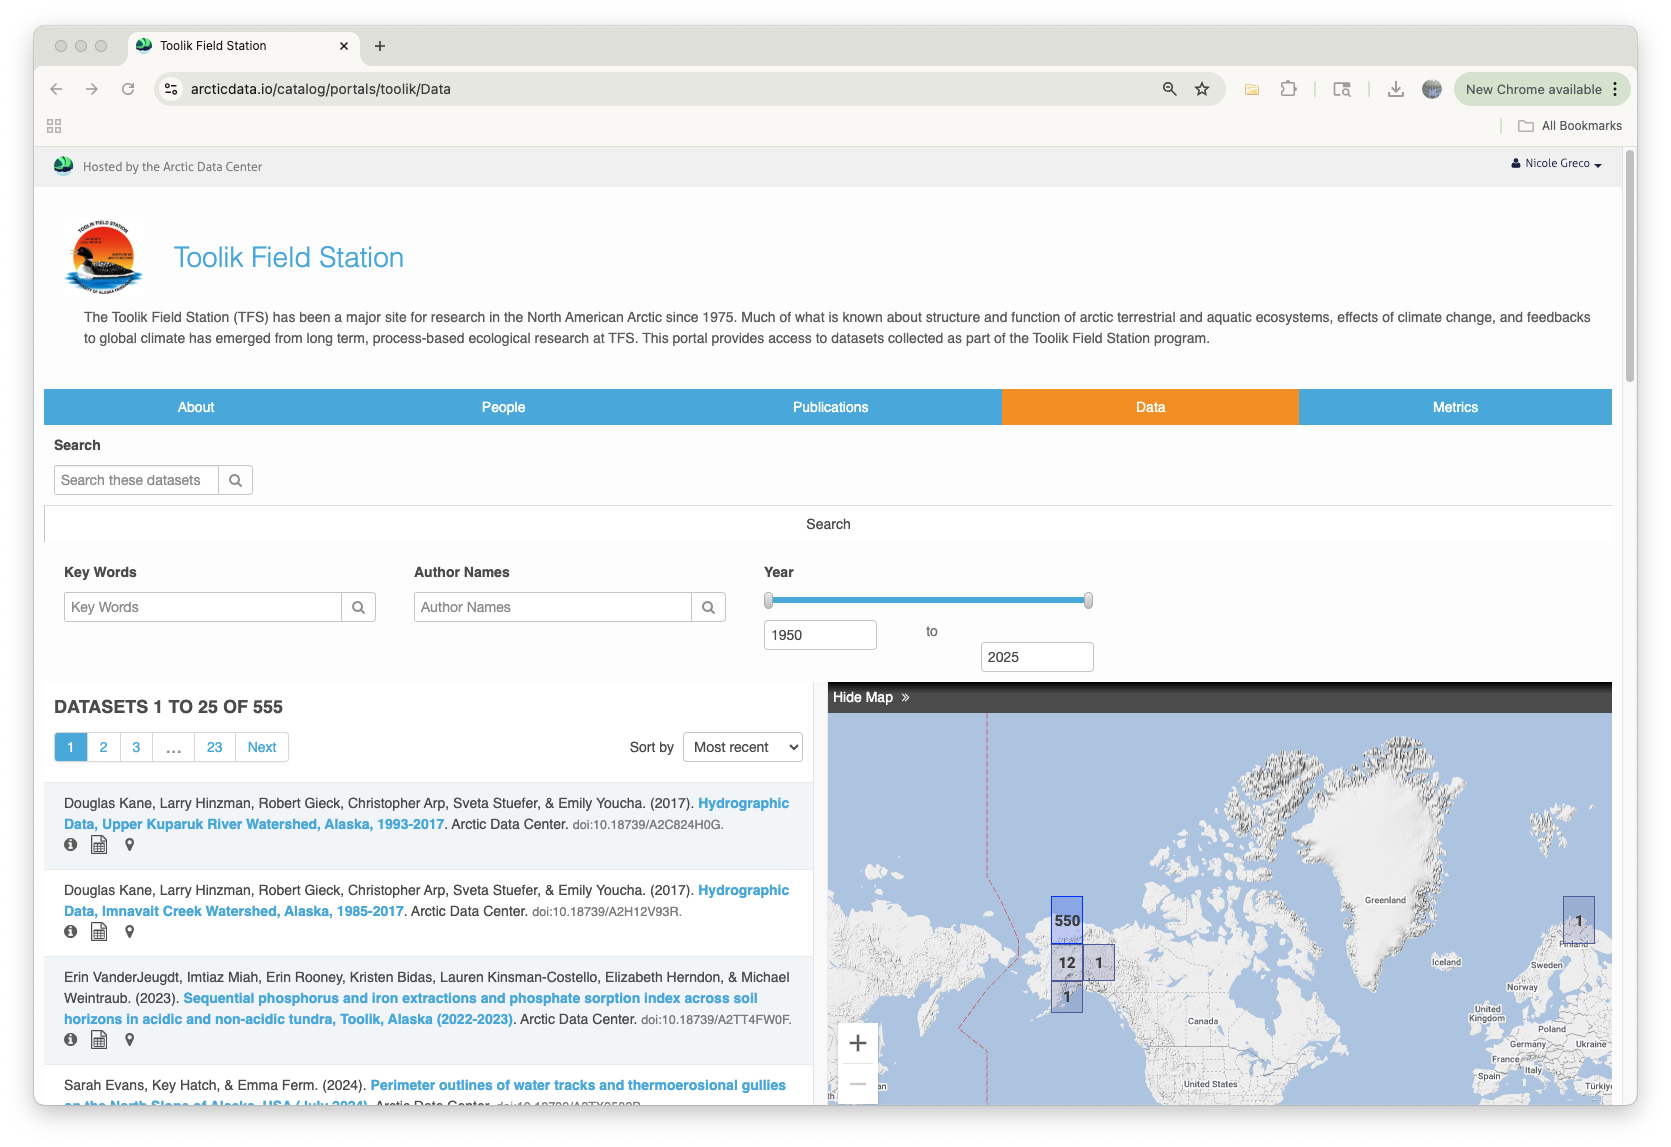
Aggregate and showcase datasets that matter most to your work. The Data page pulls content directly from the Arctic Data Center catalog, letting you filter by keywords, contributors, or themes to curate your own collection.
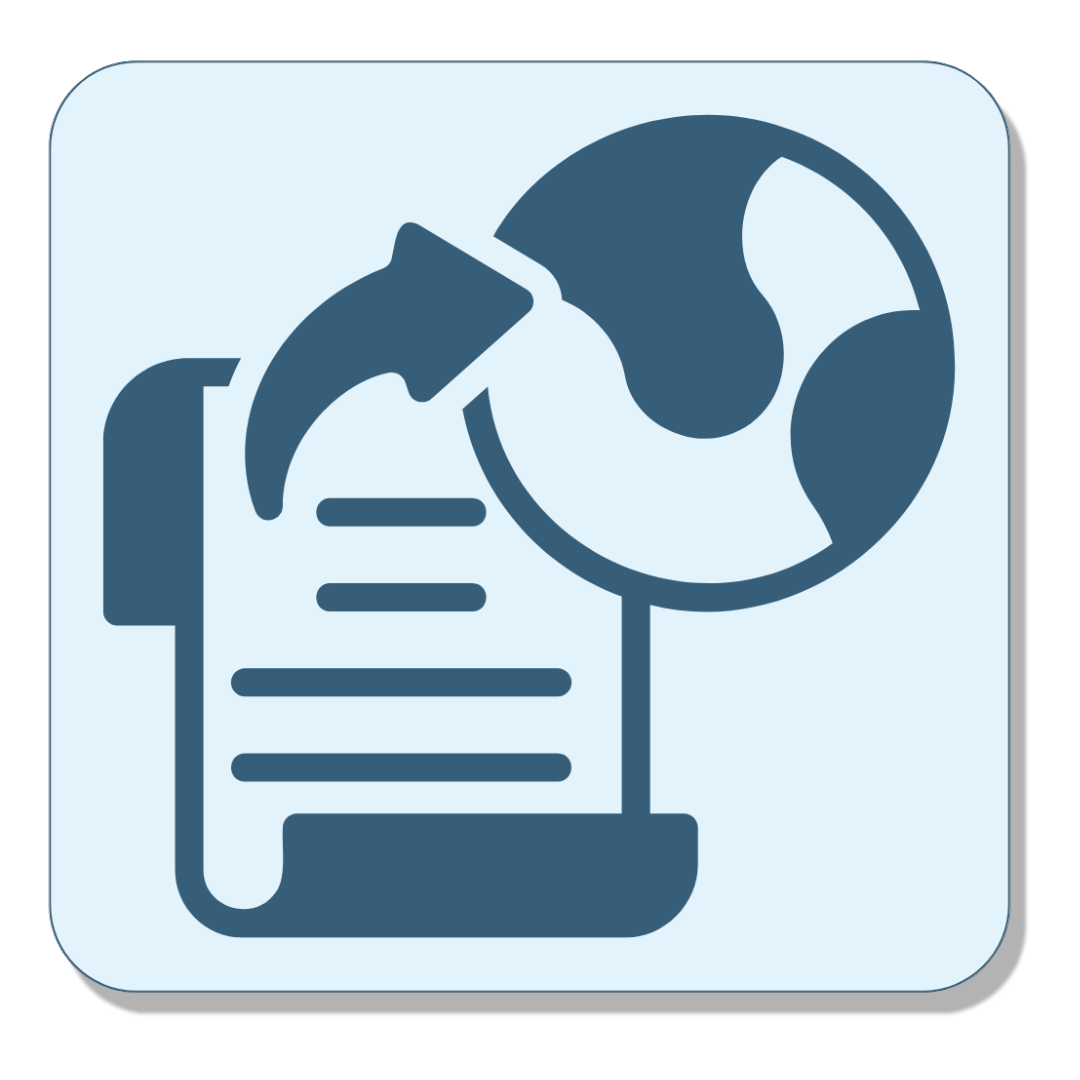
Use an interactive map to find data
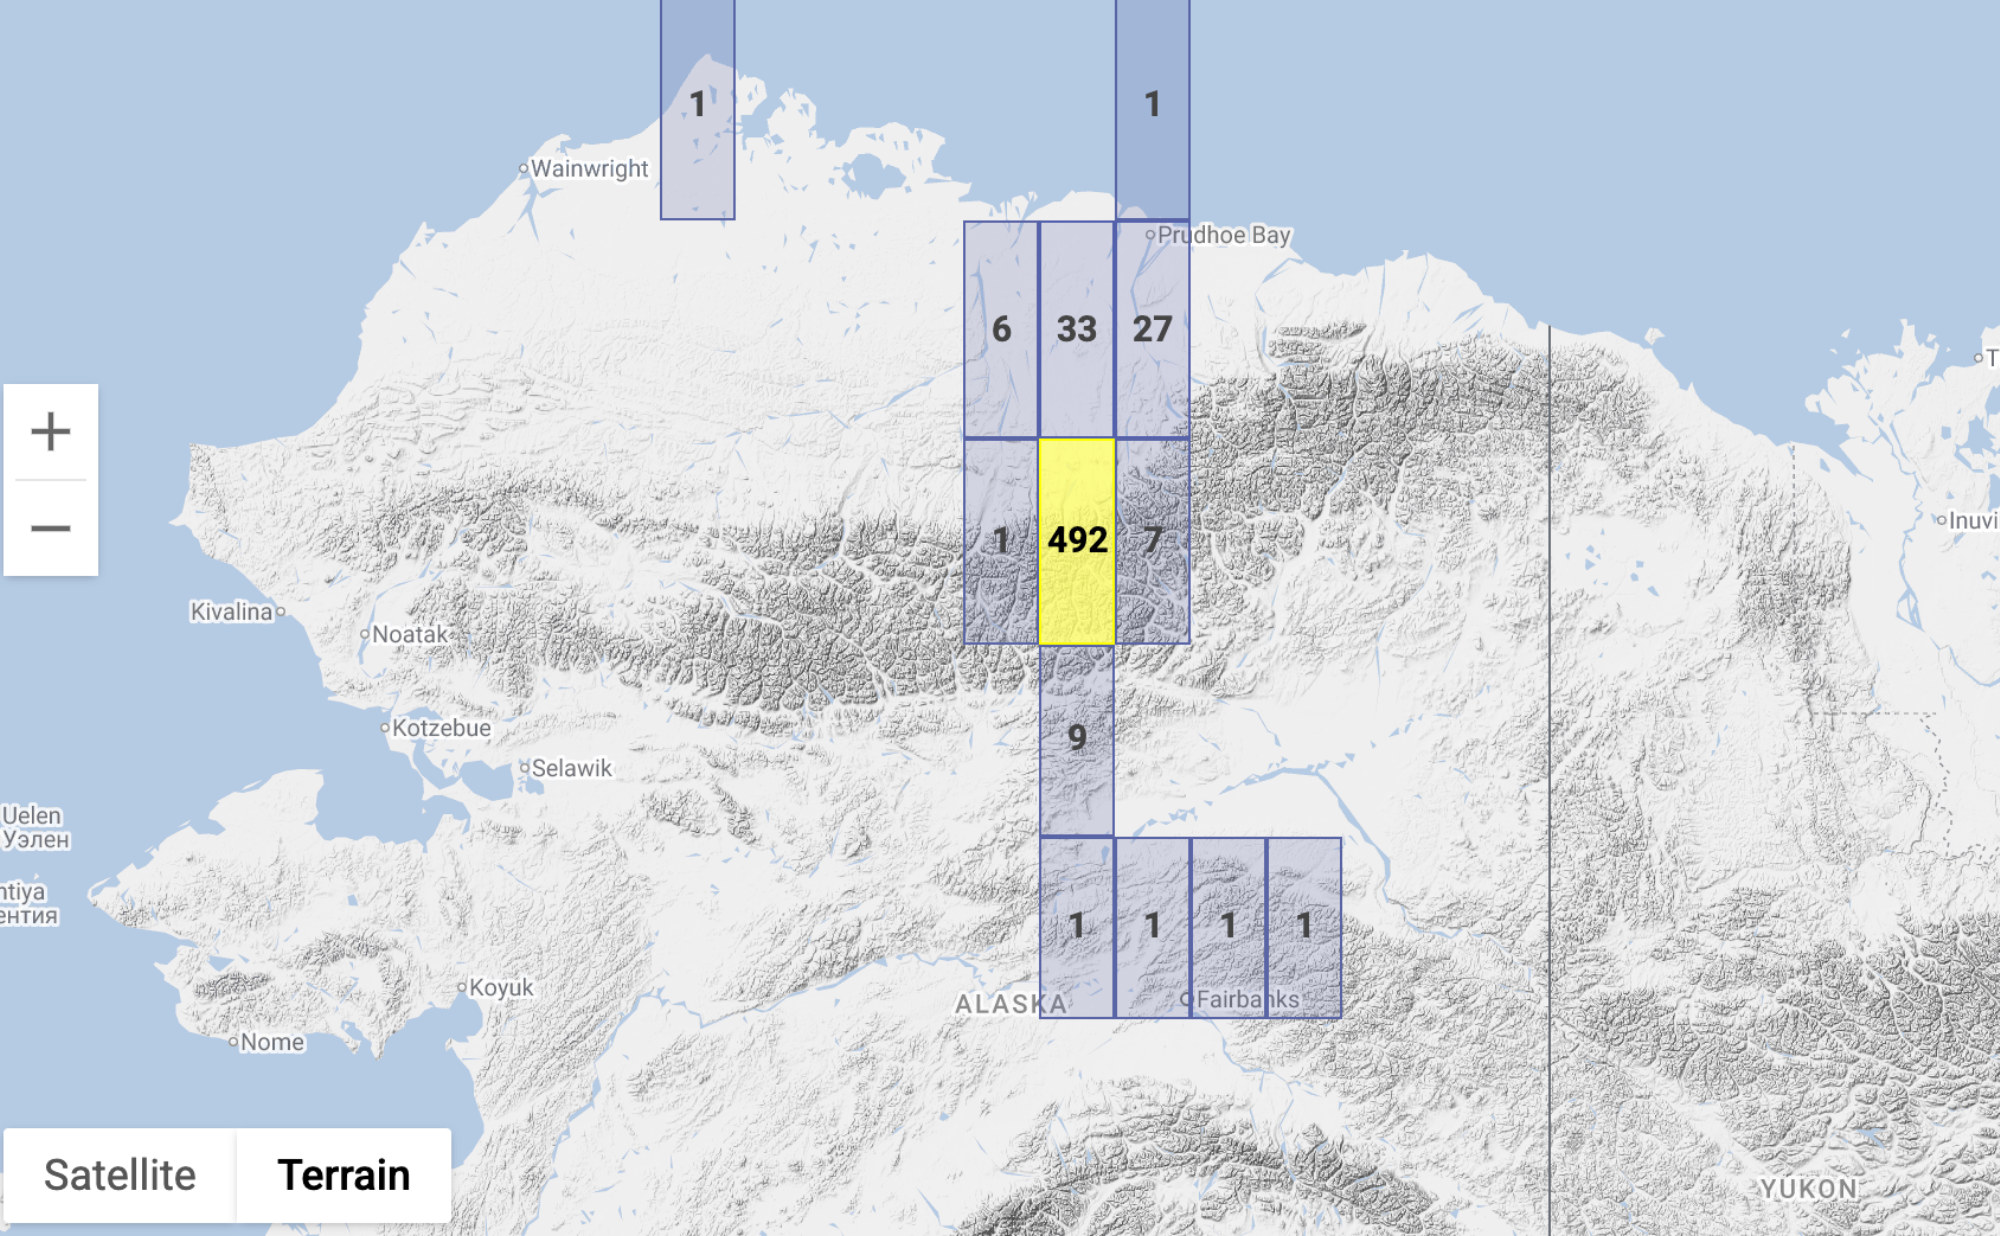
Visualize your datasets geographically with an interactive map, centered on the areas your data cover. Users can zoom in and out, pan across regions, or switch to a list view at any time, making it easy to explore your data in the way that works best for them.
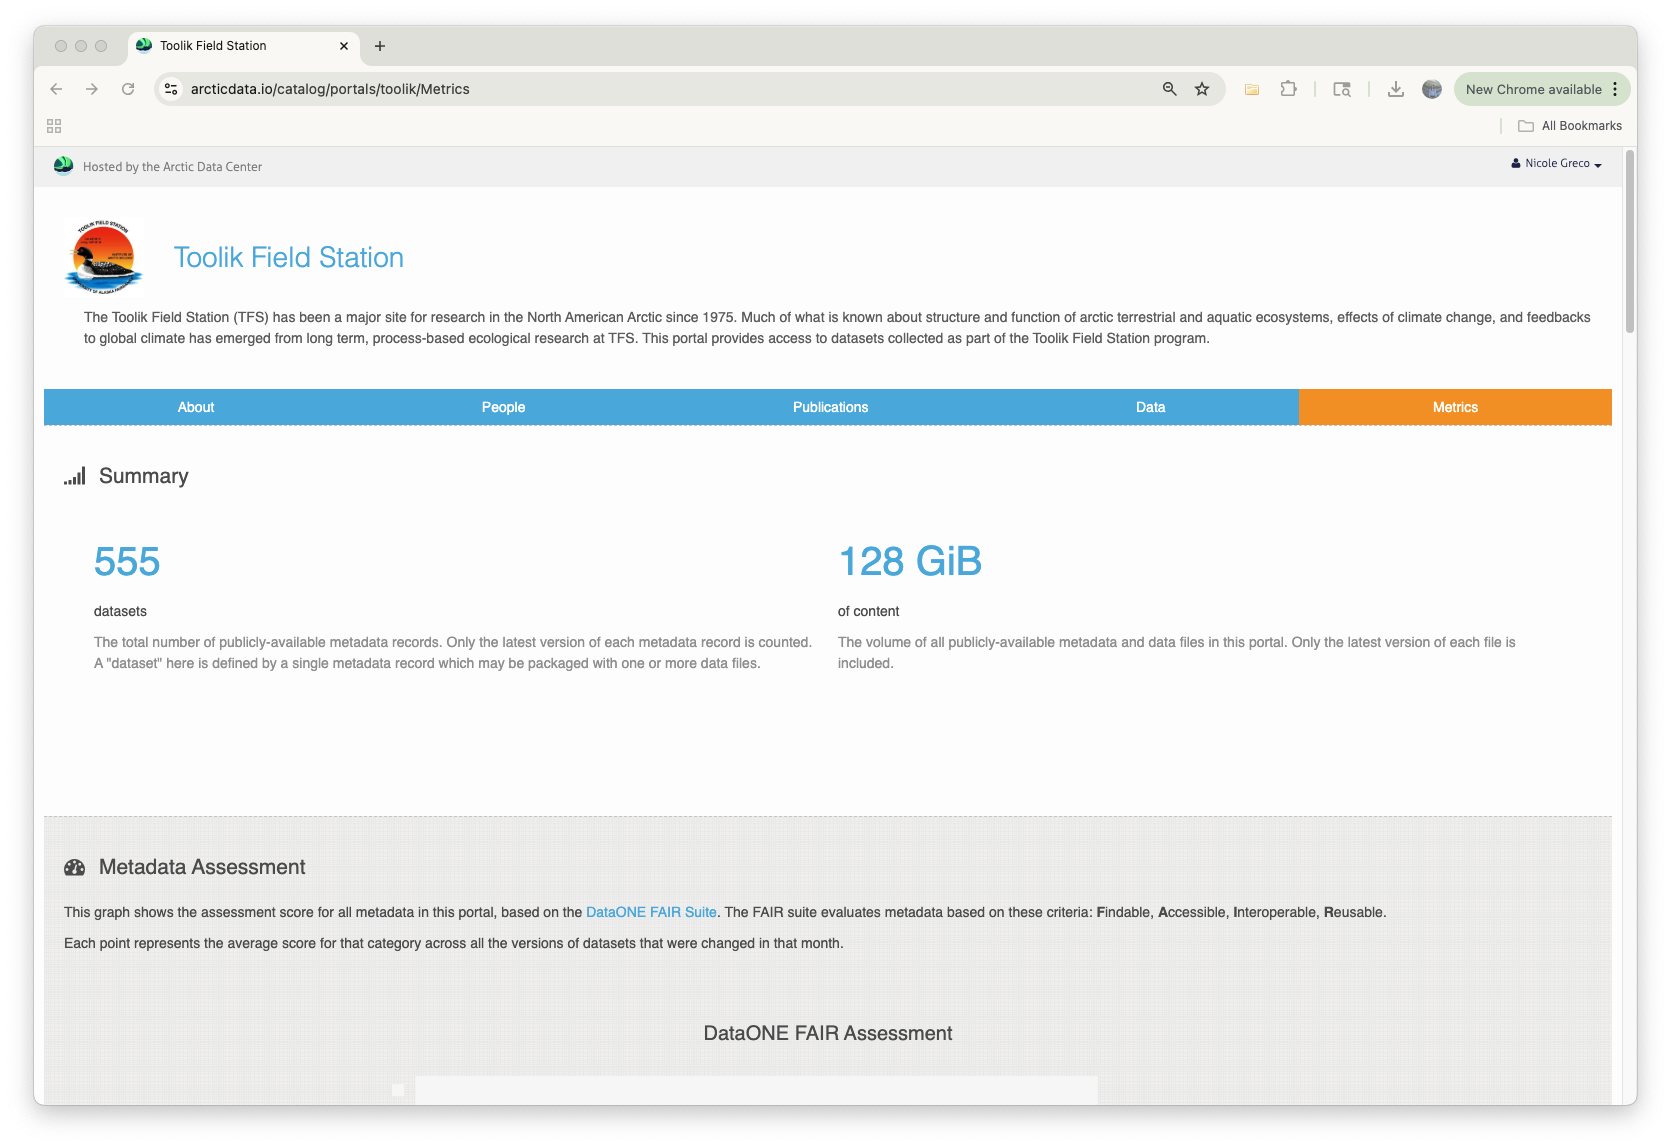
Aggregate metrics for your data
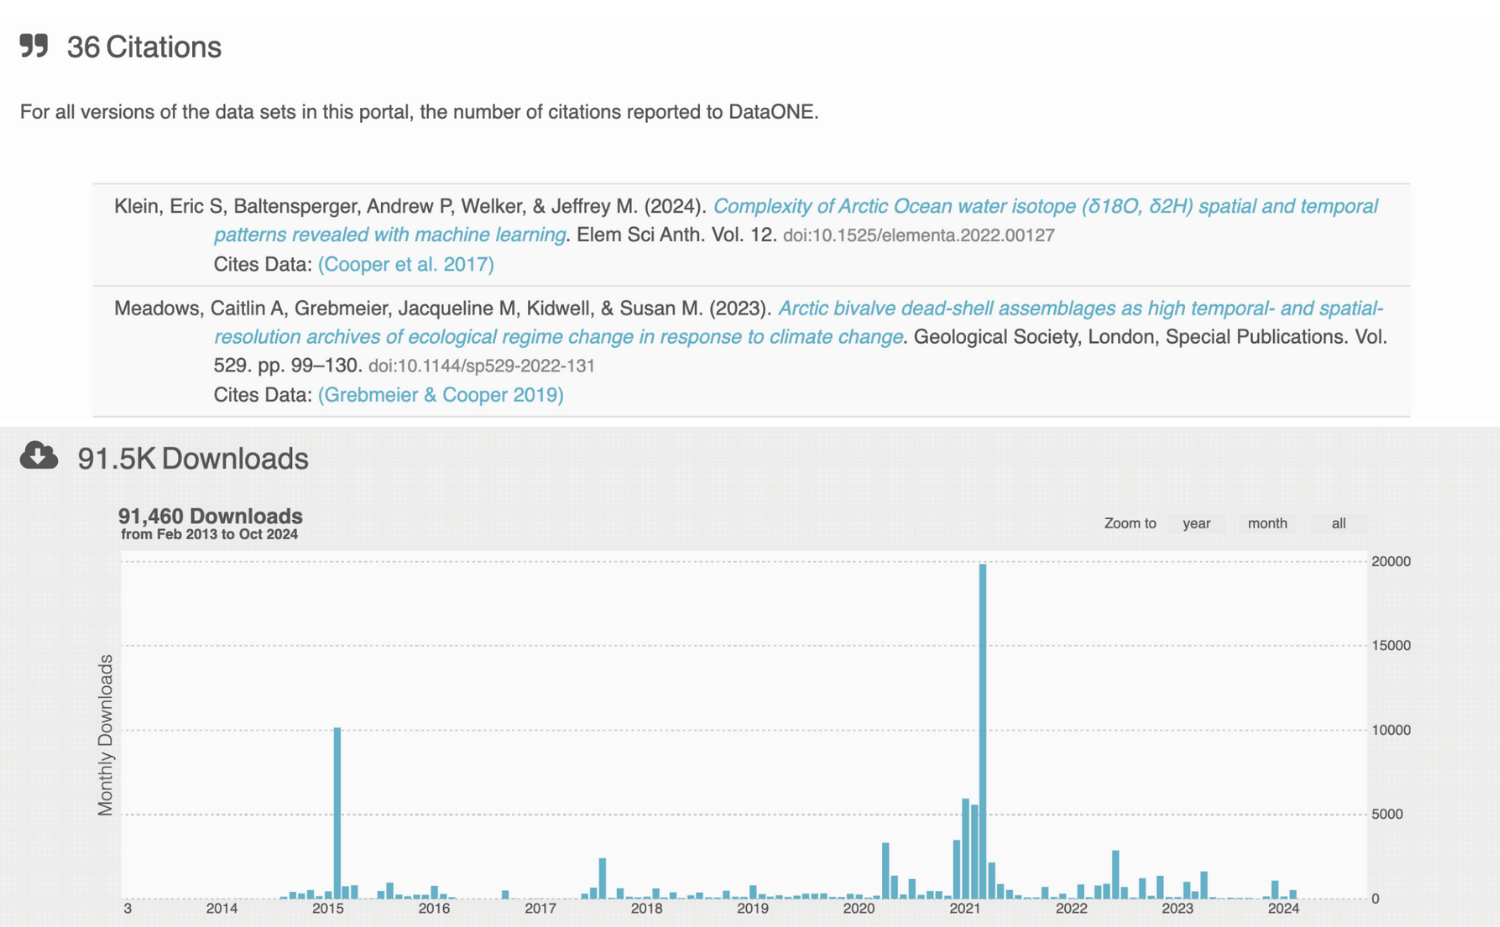
Get instant insights into your collection with dataset counts, file types, data ranges, citations, and COUNTER-compliant download and view statistics—in a format perfect for sharing with colleagues and funders.
Custom pages that go beyond data
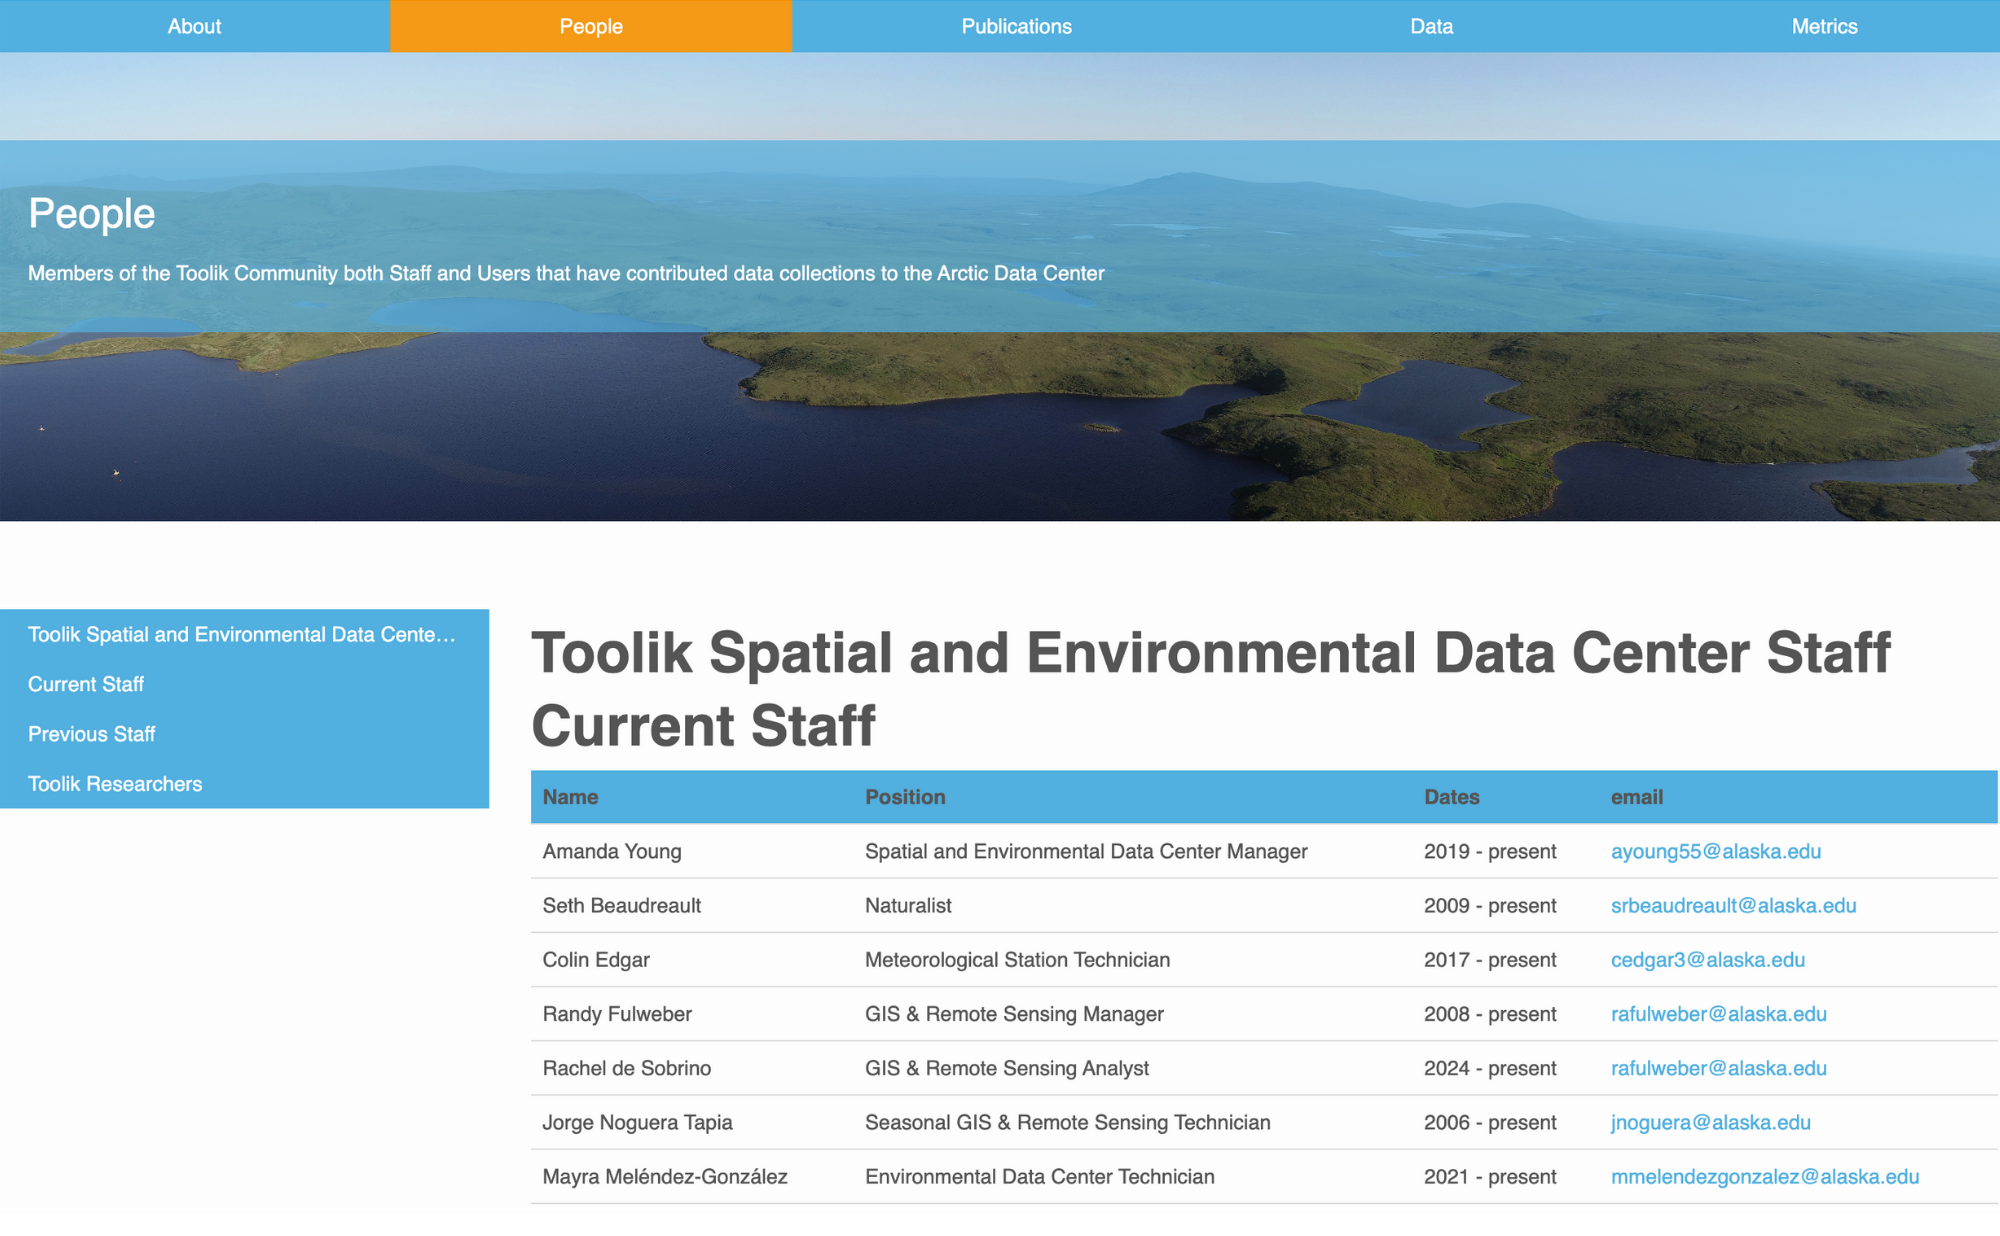
Create custom pages in your portal to highlight different aspects of your project. Our easy-to-use editor can help showcase photos, visualizations, link to publications, and more. These flexible pages give you the freedom to shape your portal to your liking.
Custom Geospatial Maps
This video demonstrates a custom portal map page on the Permafrost Discovery Gateway, showing how datasets, like retrogressive thaw slump measurements, can be explored interactively. Users can zoom, pan, and filter visible data layers.
Have an idea for an interactive data layer in your portal? Reach out to our data curation team to get started: support@arcticdata.io
Custom Interactive Visualizations
This example from the Salmon Knowledge Portal highlights how Shiny Apps can make data portals interactive and user-friendly. By embedding Shiny Apps directly within a portal page, users can explore datasets in real-time, filter information, and visualize patterns.
Interested in adding interactivity to your data portal? Contact our team for collaboration opportunities: support@arcticdata.io
Click On Portal Components to Learn More
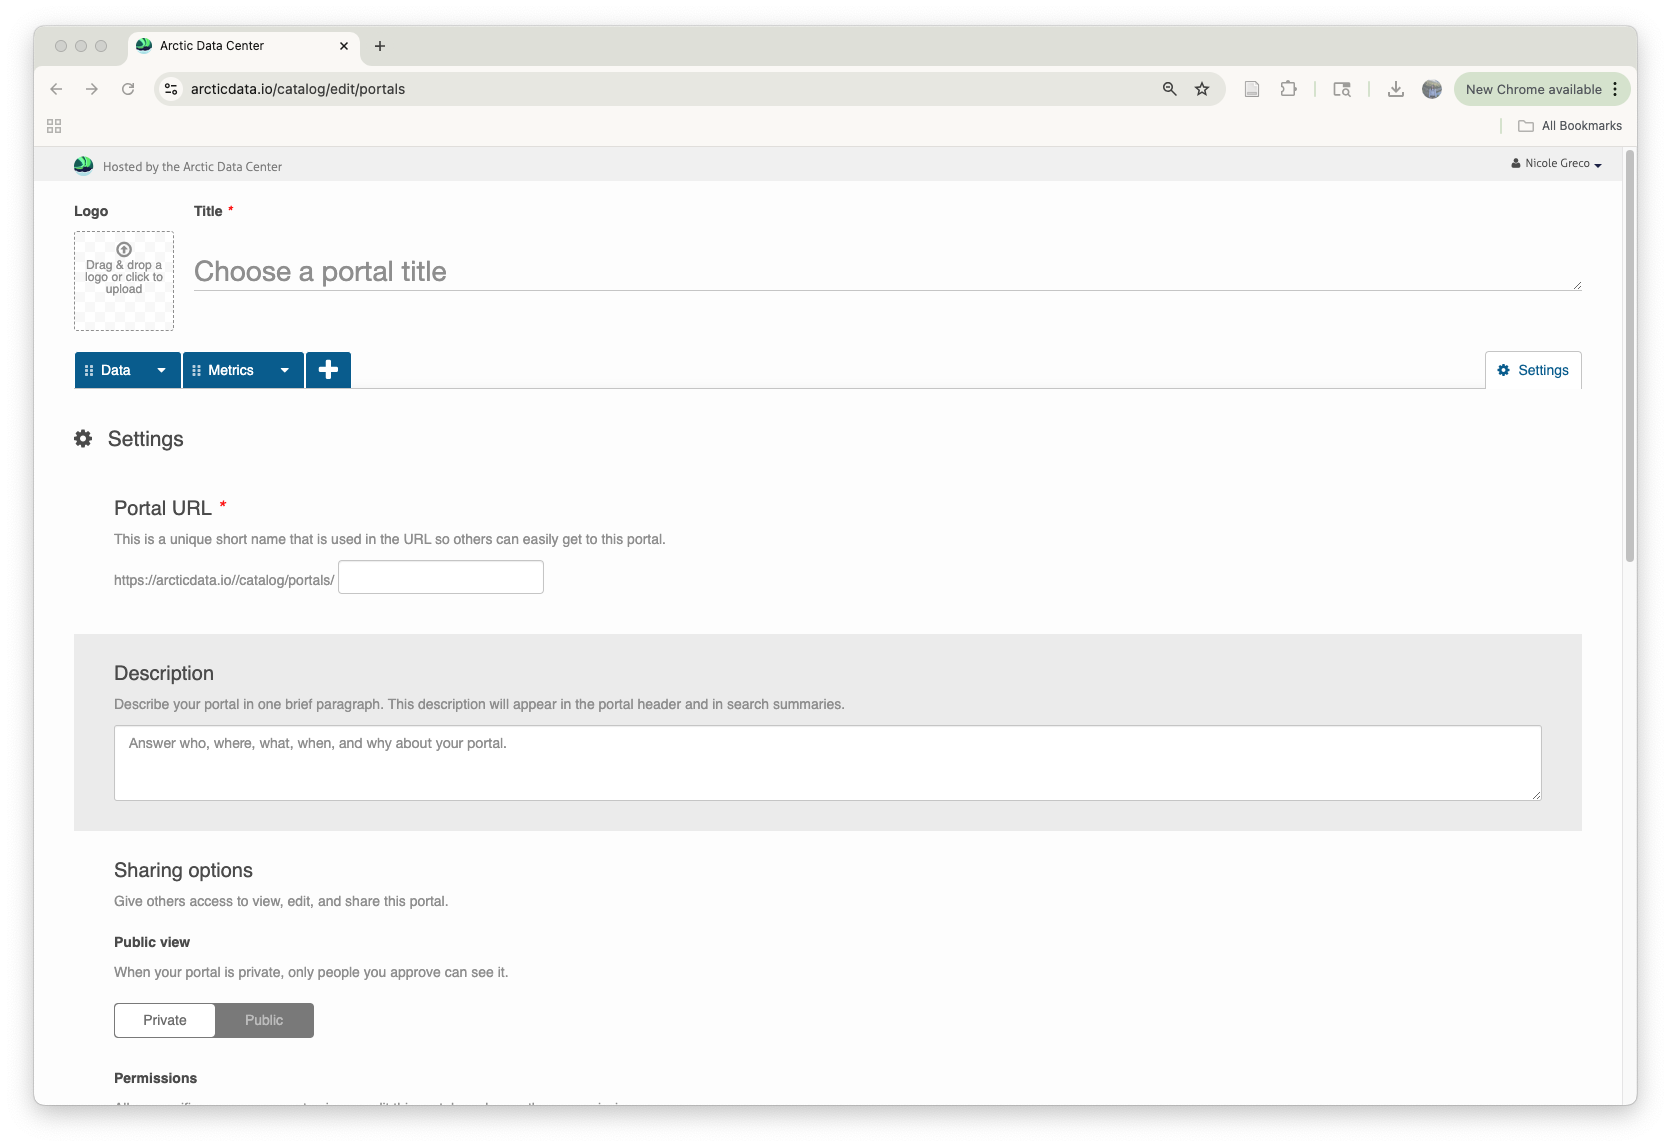
When you set up a new portal, this will be the first page you encounter. We recommend taking a few moments to personalize it by adding key details about your portal. Upload your logo, include a clear title and description, and use the markdown editor to add any additional text or formatting that helps introduce your portal to visitors. Tabs can be organized in any order within your portal.